Monthly Production Report for July,2020
- Production of Crude Oil
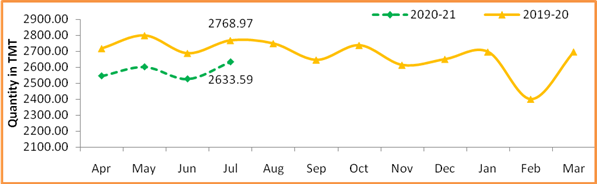
Crude oil production during July,2020 was2633.59 TMT which is 4.94% lower than target and4.89% lower when compared with July2019.Cumulative crude oil production during April-July, 2020 was 10308.78 TMT which is 3.53% and 6.08% lower than target for the period and production during corresponding period of last year respectively.Unit-wise and State-wise crude oil production is given at Annexure-I. Unit-wise crude oil production for the month of July, 2020 and cumulatively for the period April-July, 2020 vis-à-vis same period of last year has been shown in Table-1 and month-wise in Figure-1.
Table-1: Crude Oil Production (in TMT)
| Oil Company | Target | July (Month) | April-July (Cumulative) | ||||||
| 2020-21 (Apr-Mar) | 2020-21 | 2019-20 | % over last year | 2020-21 | 2019-20 | % over last year | |||
| Target | Prod.* | Prod. | Target | Prod.* | Prod. | ||||
| ONGC | 20931.54 | 1796.69 | 1738.56 | 1731.29 | 100.42 | 6975.99 | 6806.96 | 6867.80 | 99.11 |
| OIL | 3268.00 | 266.59 | 250.61 | 273.82 | 91.52 | 1031.33 | 997.00 | 1080.45 | 92.28 |
| PSC Fields | 8265.00 | 707.10 | 644.42 | 763.86 | 84.36 | 2679.16 | 2504.81 | 3027.42 | 82.74 |
| Total | 32464.53 | 2770.38 | 2633.59 | 2768.97 | 95.11 | 10686.48 | 10308.78 | 10975.66 | 93.92 |
Note: 1. Target for the year 2020-21 is provisional, subject to finalization. *: Provisional
2. Totals may not tally due to rounding off.
Figure-1: Monthly Crude Oil Production
Unit-wise production details with reasons for shortfall are as under:
-
- Crude oil production by ONGC in nomination block during July, 2020 was 1738.56 TMT which is 3.24%lower than target but 0.42%higher when compared with July 2019. Cumulative crude oil production by ONGC during April-July, 2020 was 6806.96 TMT which is 2.42%and 0.89% lower than target for the period andproduction during corresponding period of last year respectively. Reasons for shortfall in production are as under:
- Production planned from WO16 cluster from June’20 could not be realized due to delay in MOPU (SagarSamrat) as activities at GPC yard Abu Dhabi got affected due to Covid restrictions/lockdown
- Production planned from new wells in Ratna field affected due to non- availability of ESPs due to implications of COVID-19.
- Production planned from new wells from Cluster-8 project has been affected due to toppling of D-30-2 platform jacket during installation and further delay in installation of new platforms due to COVID implications
-
- Crude oil production by OIL in the nomination during July, 2020 was250.61 TMT which is 5.99% lower than the monthly target and 8.48% lower than the July, 2019. Cumulative crude oil production by OIL during April-July, 2020 was 997.0 TMT which is 3.33% and 7.72% lower than target for the period and production during corresponding period of last year respectively. Reasons for shortfall in production are as under:
- Less than planned contribution from workover and drilling wells.
- Less than planned contribution from Old well due to rise in water cut in wells & decline in total liquid production of wells.
- Loss of oil production due to bandh/blockade by local people /union /association after the blow out at BGN#5 and nearby areas.
-
- Crude oil production by Pvt/JVs in the PSC regime during July,2020 was 644.42 TMT which islower by 8.86% than the monthly target and 15.64%lowerthanJuly, 2019.Cumulative crude oil production by Pvt/JVs during April-July, 2020 was 2504.81 TMT which is 6.51% and 17.26% lower than target for the period and production during corresponding period of last year respectively.Reasons for shortfall in production are as under:
- RJ-ON-90/1 (Rajasthan Block): (1) Mangala – Near term impact of pre-production and optimization jobs including zone conversions. (2) Bhagyam – Higher PCP & electrical failures, delayed start-up full field polymer injection and additional downtime due to OHL/Grid failure (3) Aishwarya – Delayed startup of polymer injection in full field, lower UF VRR and additional downtime due to ESP failure in 3 producer wells. (4) ABH – Delay in hookup of ABH Stage-2 wells. (5) Saraswati – Sara1 is shut-in (SRP stopped) due to no liquid flow observed. (CEIL)
- CY-ONN-2002/2: Well MDDD was planned to put on production in June 2020, however, it could not be taken up due to local agitation. (ONGC)
- CB-ONN-2000/1: (1) Well PK#2 is not producing due to casing collapse and soil breakthrough in the well. (2) Well SE_DEV#1, SE#1A and SE1#A1 is shut-in due to unavailability of effective demulsifier to break tight water and oil emulsion. (3) Minor shortfall in production in SRP operated well (PK2#A1, PK2#A2 & PL#1) due to power failure by UGVCL (power distributer). (GSPC)
- KG-ONN-2003/1: Delay in completion of new infill wells on account of pending FDP submission and decline in production from 02 wells. (ONGC)
- Production of Natural Gas
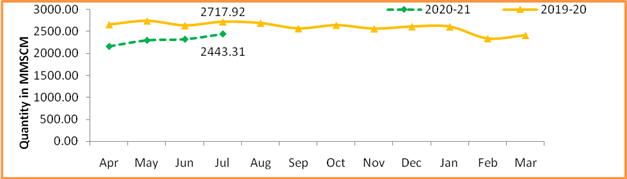
Natural gas production during July,2020 was 2443.31MMSCM which is 12.41% lower than the monthly target and 10.10% lower when compared with July, 2019. Cumulative natural gas production during April-July, 2020 was 9228.46 MMSCM which is 11.47% and 14.14% lower than target for the period and production during corresponding period of last year respectively. Unit-wise and state-wise natural gas production is given at Annexure-II. Unit-wise natural gas production for the month of July, 2020 and cumulatively for the period April-July, 2020 vis-à-vis same period of last year has been shown in Table-2 and month-wise in Figure-2.
Table-2: Natural Gas Production (inMMSCM)
| Oil Company | Target | July (Month) | April-July (Cumulative) | ||||||
| 2020-21 (Apr-Mar) | 2020-21 | 2019-20 | % over last year | 2020-21 | 2019-20 | % over last year | |||
| Target | Prod.* | Prod. | Target | Prod.* | Prod. | ||||
| ONGC | 24437.08 | 2091.05 | 1925.55 | 2023.37 | 95.17 | 8147.66 | 7276.15 | 8151.05 | 89.27 |
| OIL | 3181.54 | 268.04 | 203.03 | 235.84 | 86.09 | 1002.65 | 852.55 | 915.73 | 93.10 |
| PSC Fields | 6826.82 | 430.24 | 314.73 | 458.71 | 68.61 | 1273.42 | 1099.76 | 1681.99 | 65.38 |
| Total | 34445.44 | 2789.34 | 2443.31 | 2717.92 | 89.90 | 10423.73 | 9228.46 | 10748.77 | 85.86 |
Note: 1. Target for the year 2020-21 is provisional, subject to finalization. *: Provisional
2. Totals may not tally due to rounding off.
Figure-2: Monthly Natural Gas Production
-
- Natural gas production by ONGC in the nomination during July, 2020 was 1925.55MMSCM which is 7.91% lower than target and 4.83% lower when compared with July 2019. Cumulative natural gas production by ONGC duringApril-July, 2020 was 7276.15 MMSCM which is 10.70% and 10.73% lower than target for the period and production during corresponding period of last year respectively.Reasons for shortfall in production are as under:
- Production planned from WO16 cluster from June’20 could not be realized due to delay in MOPU (SagarSamrat) as activities at GPC yard Abu Dhabi got affected due to Covid restrictions/lockdown
- Less than planned production from Vasistha/S1 wells in EOA due to certain sub-surface issues
- Restricted/ no gas off take by consumers in onshore due to Covid-19 situation and shutdown at consumers’ end.
-
- Natural gas production by OILin the nomination during July, 2020 was 203.03 MMSCM which is 24.26% lower than monthly target and 13.91% lower than July, 2019. Cumulative natural gas production by OIL during April-July, 2020 was 852.55 MMSCM which is 14.97% and 6.90% lower than target for the period and production during corresponding period of last year respectively. Reasons for shortfall in production are as under:
- Low Up-liftment by NTPS due to various maintenance issues of gas turbines.
- Loss of natural gas production due to bandh/blockade by local people /union /association after the blow out at BGN#5 and nearby areas.
-
- Natural gas production by Pvt/JVs in the PSC regime during July,2020 was 314.73 MMSCM which is 26.85% lowerthan monthly target and31.39% lower than July, 2019. Cumulative natural gas production by Pvt/JVs during April-July, 2020 was 1099.76MMSCM which is 13.64% and 34.62% lower than target for the period and production during corresponding period of last year respectively. Reasons for shortfall in production are as under:
- KG-DWN-98/3: Production not yet commenced from the field. (RIL)
- RJ-ON/6: Less offtake by buyer. (FEL)
- RJ-ON-90/1 (Rajasthan Block): RDG – Delay in new RDG plant start up due to Covid-19. (CEIL)
- Sohagpur West: Dewatering wells gas breakout awaited, scaling in producing wells and impact of COVID-19 lockdown. (RIL)
- KG-DWN-98/2 (U-3B): Well not producing as per the anticipated profile.(ONGC)
- Crude Oil Processed (Crude Throughput)
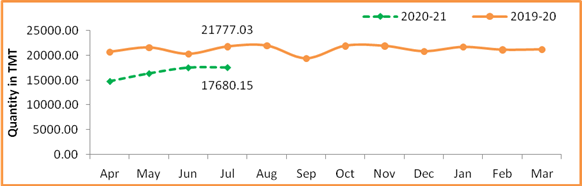
Crude Oil Processed during July, 2020 was 17680.15TMT which is 12.36% lower than the target for the month and18.81% lowerwhen compared with July, 2019. Cumulative crude throughput during April-July, 2020 was66309.54 TMT which is 18.27% and 21.40% lower than target for the period and crude throughput during corresponding period of last year respectively.Refinery-wise details of the crude throughput and capacity utilization during the month of July, 2020 vis-à-vis July, 2019 are given at Annexures-III and Annexures -IV. Company-wise crude throughput for the month of July, 2020 and cumulatively for the period April-July, 2020vis-à-vis same period of last year has been shown in Table-3 and month-wise in Figure-3.
Table 3: Crude Oil Processed(Crude Throughput) (in TMT)
| Oil Company | Target | July (Month) | April-July (Cumulative) | ||||||
| 2020-21 (Apr-Mar) | 2020-21 | 2019-20 | % over last year | 2020-21 | 2019-20 | % over last year | |||
| Target | Prod.* | Prod. | Target | Prod.* | Prod. | ||||
| CPSE | 148031.12 | 12194.83 | 10374.45 | 13424.02 | 77.28 | 46702.62 | 36177.39 | 47947.38 | 75.45 |
| IOCL | 72499.86 | 5803.01 | 5363.00 | 6415.95 | 83.59 | 22765.42 | 18292.91 | 23698.75 | 77.19 |
| BPCL | 30499.95 | 2670.63 | 1940.60 | 2761.21 | 70.28 | 10429.64 | 7011.05 | 10201.53 | 68.73 |
| HPCL | 17867.47 | 1556.59 | 1354.77 | 1626.65 | 83.29 | 6125.93 | 5325.06 | 5542.10 | 96.08 |
| CPCL | 9000.00 | 580.00 | 723.80 | 925.24 | 78.23 | 2060.00 | 2051.77 | 3547.17 | 57.84 |
| NRL | 2700.00 | 229.00 | 219.30 | 259.06 | 84.65 | 902.00 | 844.51 | 940.28 | 89.82 |
| MRPL | 15400.00 | 1350.00 | 765.71 | 1428.43 | 53.61 | 4400.00 | 2629.20 | 3988.55 | 65.92 |
| ONGC | 63.83 | 5.61 | 7.27 | 7.49 | 97.04 | 19.64 | 22.89 | 29.00 | 78.92 |
| JVs | 14772.00 | 1236.00 | 1446.92 | 1609.70 | 89.89 | 4866.00 | 4637.17 | 6850.47 | 67.69 |
| BORL | 7800.00 | 660.00 | 411.47 | 523.39 | 78.62 | 2600.00 | 1571.02 | 2576.36 | 60.98 |
| HMEL | 6972.00 | 576.00 | 1035.45 | 1086.30 | 95.32 | 2266.00 | 3066.15 | 4274.11 | 71.74 |
| Private | 89515.16 | 6743.31 | 5858.77 | 6743.31 | 86.88 | 29562.75 | 25494.99 | 29562.75 | 86.24 |
| RIL | 68894.99 | 4960.37 | 4298.86 | 4960.37 | 86.66 | 22586.33 | 19578.14 | 22586.33 | 86.68 |
| EOL | 20620.18 | 1782.94 | 1559.91 | 1782.94 | 87.49 | 6976.43 | 5916.84 | 6976.43 | 84.81 |
| TOTAL | 252318.28 | 20174.14 | 17680.15 | 21777.03 | 81.19 | 81131.38 | 66309.54 | 84360.60 | 78.60 |
Note: 1. Target for the year 2020-21 is provisional, subject to finalization. *: Provisional
2. Totals may not tally due to rounding off.
Figure 3: Crude Oil Processed (Crude Throughput)
-
- CPSE Refineries’ crude oil processed during July, 2020 was 10374.45TMT which is 14.93% lower than the target for the month and22.72%lowerwhen compared with July, 2019.Cumulative crude throughputby CPSE refineries during April-July, 2020 was 36177.39TMT which is 22.54% and 24.55% lower than target for the period and crude throughputduring corresponding period of last year respectively.Reasons for shortfall in production are as under:
- IOCL- Barauni, Haldia, Mathura and Panipat: Lower due to COVID-19 Pandemic i.e. low product demand.
- IOCL- Digboi: Lower due to DCU shutdown.
- BPCL-Kochi: Actual crude charge was maintained in order to meet the demand for the products.
- HPCL-Mumbai& Visakh: Lower due to planned shutdown of secondary units.
- CPCL-Manali: Lower due to lower product demand on account of Covid-19 lockdown.
- MRPL-Mangalore: Lower due to Lower demand due to impact of Covid-19 lockdown.
- NRL- Numaligarh: Lower, due to maintained in line with demand of MS/HSD
- BORL-Bina: Lower due to lower product demand in view of COVID 19 pandemic and ongoing monsoon.
3.2 JV refineries’ crude oil processed during July, 2020 was 1446.92TMT which is 17.06% higher than the target for the month but 10.11% lower when compared with July, 2019. Cumulative crude throughput during April-July, 2020 was 4637.17 TMT which is 4.70% higher than target for the period but32.31% lower and crude throughput during corresponding period of last year respectively.
3.3 Private refineries’ crude oil processed during July, 2020 was 5858.77TMT which is 13.12% lower than the corresponding month of last year. Cumulative crude throughputduring April-July, 2020 was 25494.99 TMT which is 13.76% lower than thecorresponding period of last year.
- Production of Petroleum Products
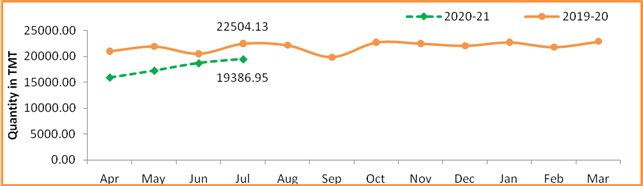
Production of Petroleum Products during July, 2020 was 19386.95 TMT which is 7.10% lower than the target for the month and 13.85% lower when compared with July, 2019. Cumulative production during April-July, 2020 was 71350.80 TMT which is 13.98% and 17.08% lower than target for the period and production during corresponding period of last year respectively. Unit-wise production of petroleum products is given at Annexure-V. Company-wise production for the month of July, 2020 and cumulatively for the period April-July, 2020 vis-à-Vis same period of last year has been shown in Table-4 and month-wise in Figure-4.
Figure:4
Table 4: Monthly Refinery Production of Petorleum Products
| Oil Company | Target | July (Month) | April-July (Cumulative) | ||||||
| 2020-21 (Apr-Mar) | 2020-21 | 2019-20 | % over last year | 2020-21 | 2019-20 | % over last year | |||
| Target | Prod.* | Prod. | Target | Prod.* | Prod. | ||||
| CPSE | 139203.86 | 11445.01 | 9930.07 | 12703.62 | 78.17 | 44021.41 | 34185.71 | 45088.12 | 75.82 |
| IOCL | 68912.87 | 5461.18 | 5225.09 | 6114.01 | 85.46 | 21660.94 | 17418.29 | 22513.40 | 77.37 |
| BPCL | 28965.13 | 2578.87 | 1830.86 | 2593.35 | 70.60 | 9959.07 | 6729.28 | 9606.88 | 70.05 |
| HPCL | 16438.97 | 1432.50 | 1256.33 | 1553.55 | 80.87 | 5642.10 | 4999.94 | 5154.88 | 96.99 |
| CPCL | 8278.87 | 526.10 | 698.91 | 876.22 | 79.76 | 1852.01 | 1875.51 | 3266.09 | 57.42 |
| NRL | 2660.91 | 226.00 | 218.64 | 250.12 | 87.42 | 889.40 | 847.91 | 905.14 | 93.68 |
| MRPL | 13887.11 | 1215.09 | 693.26 | 1309.31 | 52.95 | 3999.43 | 2293.04 | 3614.79 | 63.43 |
| ONGC | 60.00 | 5.27 | 6.98 | 7.07 | 98.75 | 18.46 | 21.74 | 26.95 | 80.66 |
| JVs | 13590.40 | 1139.48 | 1301.96 | 1505.39 | 86.49 | 4476.80 | 4329.20 | 6395.00 | 67.70 |
| BORL | 6958.40 | 591.48 | 373.31 | 471.59 | 79.16 | 2320.80 | 1346.58 | 2338.10 | 57.59 |
| HMEL | 6632.00 | 548.00 | 928.65 | 1033.80 | 89.83 | 2156.00 | 2982.62 | 4056.91 | 73.52 |
| Private | 102154.50 | 7867.56 | 7769.70 | 7867.56 | 98.76 | 32933.10 | 31467.67 | 32933.10 | 95.55 |
| RIL | 82374.12 | 6099.95 | 6310.87 | 6099.95 | 103.46 | 26208.57 | 25695.52 | 26208.57 | 98.04 |
| NEL | 19780.38 | 1767.62 | 1458.84 | 1767.62 | 82.53 | 6724.53 | 5772.15 | 6724.53 | 85.84 |
| Total Refinery | 254948.76 | 20452.05 | 19001.73 | 22076.58 | 86.07 | 81431.31 | 69982.58 | 84416.22 | 82.90 |
| Fractionators | 4572.73 | 416.32 | 385.21 | 427.56 | 90.10 | 1512.87 | 1368.21 | 1632.89 | 83.79 |
| TOTAL | 259521.49 | 20868.37 | 19386.95 | 22504.13 | 86.15 | 82944.17 | 71350.80 | 86049.11 | 82.92 |
Note: 1. Target for the year 2020-21 is provisional, subject to finalization. *: Provisional
2. Totals may not tally due to rounding off.
-
- Production of petroleum Products byOil’s Refineries during July, 2020 was 19001.73 TMT which is 7.09% lower than the target for the month and 13.93% lower when compared with July, 2019. Cumulative production of petroleum products by refineries during April-July, 2020 was 69982.58 TMT which is 14.06% and 17.10% lower than target for the period and production during corresponding period of last year respectively.
4.2 Production of petroleum Products byFractionators duringJuly, 2020 was 385.21 TMT which is 7.47% lower than the target for the month and 9.90% lower when compared with July, 2019. Cumulative production by Fractionators during April-July, 2020 was 1368.21 TMT which is 9.56% and 16.21% lower than target for the period and production during corresponding period of last year respectively.
Please click here to see the Annexures
YB/SK