Monthly Production Report for January,2021
- Production of Crude Oil
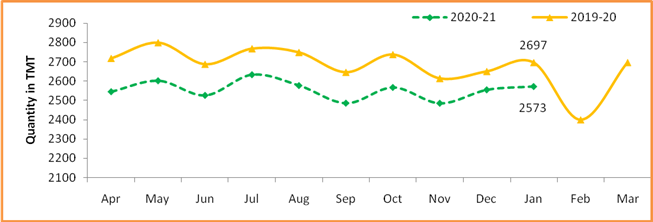
Crude oil production[1] during January,2021 was2572.69 TMT which is7.95% lower than target and4.60% lower when compared with January, 2020.Cumulative crude oil production during April-January, 2020-21 was 25554.85 TMT which is 5.54% and 5.61% lower than target for the period and production during corresponding period of last yearrespectively. Unit-wise and State-wise crude oil production is given at Annexure-I. Unit-wise crude oil production for the month of January, 2021 and cumulatively for the period April-January, 2020-21 vis-à-vis same period of last year has been shown in Table-1 and month-wise in Figure-1.
Table-1: Crude Oil Production (in TMT)
| Oil Company | Target | January (Month) | April-January (Cumulative) | ||||||
| 2020-21 (Apr-Mar) | 2020-21 | 2019-20 | % over last year | 2020-21 | 2019-20 | % over last year | |||
| Target | Prod.* | Prod. | Target | Prod.* | Prod. | ||||
| ONGC | 20931.68 | 1775.73 | 1715.74 | 1788.92 | 95.91 | 17583.67 | 16924.83 | 17175.88 | 98.54 |
| OIL | 3121.00 | 269.34 | 242.58 | 257.55 | 94.19 | 2603.53 | 2469.27 | 2612.29 | 94.53 |
| PSC Fields | 8265.00 | 749.92 | 614.37 | 650.30 | 94.48 | 6867.57 | 6160.75 | 7284.16 | 84.58 |
| Total | 32317.68 | 2794.99 | 2572.69 | 2696.77 | 95.40 | 27054.77 | 25554.85 | 27072.34 | 94.39 |
Note: Totals may not tally due to rounding off. *: Provisional
Figure-1: Monthly Crude Oil Production
Unit-wise production details with reasons for shortfall are as under:
- Crude oil production by ONGC(Oil and Natural Gas Corporation) in nomination block during January, 2021 was 1715.74TMT which is 3.38%lower than target and 4.09%lower when compared with January 2020. Cumulative crude oil production by ONGC during April-January, 2020-21 was 16924.83 TMT which is 3.75%and 1.46% lower than target for the period andproduction during corresponding period of last year respectively. Reasons for shortfall in production are as under:
- Production planned from WO-16 cluster could not be realized due to delay in MOPU (Sagar Samrat) as activities at GPC yard Abu Dhabi got affected due to COVID-19 restrictions / lockdown.
- Production planned from new wells in Ratna field affected due to non- availability of ESPs due to implications of COVID-19. Presently rigs are deployed at two well platforms and wells are being completed with ESPs.
- New wells planned under Cluster-8 development project affected due to delay in installation of new platforms due to COVID implications.
- Crude oil production by OIL(Oil India Ltd) in the nominationblock during January, 2021 was242.58 TMT which is 9.94% % lower than target and 5.81% lower when compared with January 2020. Cumulative crude oil production by OIL during April-January, 2020-21 was 2469.27 TMT which is 5.16% and 5.47% lower than target for the period and production during corresponding period of last year respectively. Reasons for shortfall in production are as under:
- Less than planned contribution from workover wells, drilling wells and old wells.
- Bandhs /blockade by local people and associations after the Baghjan Blowout.
- Crude oil production by Pvt/JVscompanies in the PSC (Production Sharing Contract) regime during January, 2021 was 614.37 TMT which islower by 18.08% than the monthly target and 5.52%lowerthanJanuary, 2020.Cumulative crude oil production by Pvt/JVs companies during April-January, 2020 was 6160.75 TMT which is 10.29% and 15.42% lower than target for the period and production during corresponding period of last year respectively.Reasons for shortfall in production are as under:
- RJ-ON-90/1 (Cairn Energy India Ltd): Delay in Mangla upgradation plan and multiple well failures in Mangala field. Delayed start up full field polymer injection in Bhagyam and Aishwarya field. Delay in hook-up of stage-2 wells in ABH. Flow cease in few wells of Satellite fields. Project schedule of well and surface facility of Tukaram, Kaam-1 and GSV Condensate is impacted by COVID-19
- RAVVA (Cairn Energy India Ltd): Decline in production from producer wells.
- B-80 (Hindustan Oil Exploration Company Ltd): Production from B80 field not commenced due to delay in completion of field development activities because of COVID.
- CB-ONN-2003/1 (SUN PETROCHEMICALS PVT. LTD.): Delay in drilling of new wells due to COVID-19 situation and less crude offtake by the consumer.
- Production of Natural Gas
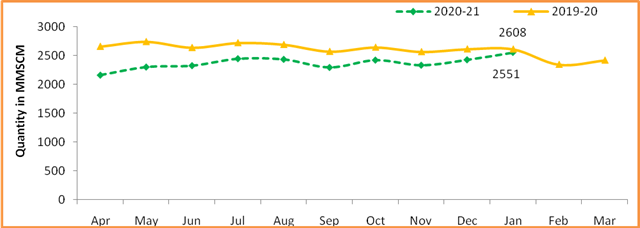
Natural gas production during January,2021 was 2550.62MMSCM which is 19.20% lower than the monthly target and 2.21% lower when compared with January, 2020. Cumulative natural gas production during April-January, 2020-21 was 23679.54MMSCM which is 14.05% and 10.40% lower than target for the period and production during corresponding period of last year respectively. Unit-wise and state-wise natural gas production is given at Annexure-II. Unit-wise natural gas production for the month of January, 2021 and cumulatively for the period April-January, 2020-21 vis-à-vis same period of last year has been shown in Table-2 and month-wise in Figure-2.
Table-2: Natural Gas Production (inMMSCM)
| Oil Company | Target | January (Month) | April-January (Cumulative) | ||||||
| 2020-21 (Apr-Mar) | 2020-21 | 2019-20 | % over last year | 2020-21 | 2019-20 | % over last year | |||
| Target | Prod.* | Prod. | Target | Prod.* | Prod. | ||||
| ONGC | 23982.98 | 2050.73 | 1865.68 | 2052.42 | 90.90 | 20080.75 | 18410.00 | 19970.70 | 92.19 |
| OIL | 2761.73 | 255.27 | 211.94 | 208.48 | 101.66 | 2262.12 | 2081.76 | 2255.85 | 92.28 |
| PSC Fields | 6826.82 | 850.86 | 473.00 | 347.44 | 136.14 | 5207.76 | 3187.77 | 4201.73 | 75.87 |
| Total | 33571.53 | 3156.86 | 2550.62 | 2608.34 | 97.79 | 27550.63 | 23679.54 | 26428.28 | 89.60 |
Note: Totals may not tally due to rounding off. *: Provisional
Figure-2: Monthly Natural Gas Production
-
- Natural gas production by ONGC in the nominationblocks during January, 2021 was 1865.68MMSCM which is 9.02% lower than target and 9.10% lower when compared with January 2020. Cumulative natural gas production by ONGC duringApril-January, 2020-21 was 18410.0 MMSCM which is 8.32% and 7.81% lower than target for the period and production during corresponding period of last year respectively.Reasons for shortfall in production are as under:
- Less Gas production from WO16 cluster due to delay in MOPU.
- Less than planned production from Vasistha / S1 wells in EOA due certain reservoir related issues.
- Less than planned production from new subsea wells in Bassein field due to delay in subsea umbilical connections/hook up jobs in view of Covid-19 implications.
-
- Natural gas production by OILin the nomination block during January, 2021 was 211.94 MMSCM which is 1.66% higher than January, 2020 but 16.98% lower than monthly target. Cumulative natural gas production by OIL during April-January, 2020-21 was 2081.76 MMSCM which is 7.97% and 7.72% lower than target for the period and production during corresponding period of last year respectively. Reasons for shortfall in production are as under:
- Low upliftment/demand of gas by the major customers.
- Bandhs /blockade by local people and associations after the Baghjan Blowout.
-
- Natural gas production by Pvt/JVs companiesin the PSC (production sharing contracts) regime during January,2021 was 473.0MMSCM which is 36.14% higher than the January, 2020 but 44.41% lowerthan monthly target. Cumulative natural gas production by Pvt/JVs during April-January, 2020-21 was 3187.77MMSCM which is 38.79% and 24.13% lower than target for the period and production during corresponding period of last year respectively. Reasons for shortfall in production are as under:
- KG-DWN-98/3 (Reliance Industries Ltd): Impact on project progress of KG-DWN-98/3 due to COVID 19 pandemic and adverse weather conditions.
- RJ-ON/6 (Focus Energy Limited): Less gas offtake by consumers.
- KG-DWN-98/2 (Oil & Natural Gas Corpn.): U3-B well is flowing less than the expected profile and delay in commissioning of wells of U1- field.
- KG-OSN-2001/3 (Oil & Natural Gas Corpn.): Production from Well D-7 was not commenced.
- Raniganj East (Essar Oil and Gas Exploration & Production Ltd): Production curtailed due to limited sales off-take and to avoid flaring.
- Crude Oil Processed (Crude Throughput)
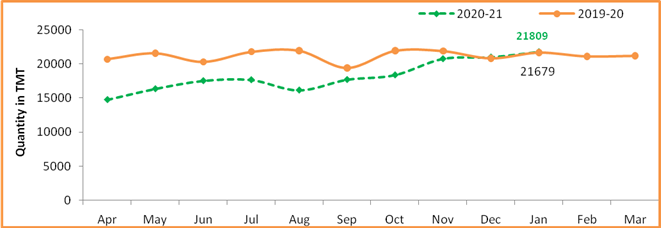
Crude Oil Processed during January, 2021 was 21809.0 TMT which is 0.6% higher than the January, 2020 and 2.81% lower than the target for the month. Cumulative crude throughput during April-January, 2020-21 was182170.49 TMT which is 13.21% and 14.10% lower than target for the period and crude throughput during corresponding period of last year respectively. Refinery-wise details of the crude throughput and capacity utilization during the month of January, 2021 vis-à-vis January, 2020 are given at Annexure-III and Annexure-IV. Company-wise crude throughput for the month of January, 2021 and cumulatively for the period April-January, 2020-21vis-à-vis same period of last year has been shown in Table-3 and month-wise in Figure-3.
Table 3: Crude Oil Processed (Crude Throughput) (in TMT)
| Oil Company | Target | January (Month) | April-January (Cumulative) | ||||||
| 2020-21 (Apr-Mar) | 2020-21 | 2019-20 | % over last year | 2020-21 | 2019-20 | % over last year | |||
| Target | Prod.* | Prod. | Target | Prod.* | Prod. | ||||
| CPSE | 147377.43 | 13532.13 | 13204.07 | 12393.11 | 106.54 | 122870.38 | 102932.70 | 120285.43 | 85.57 |
| IOCL | 72400.04 | 6517.69 | 6278.12 | 5642.57 | 111.26 | 60587.14 | 51036.68 | 57959.01 | 88.06 |
| BPCL | 33000.00 | 2850.00 | 2893.31 | 2826.33 | 102.37 | 27600.00 | 20788.42 | 26166.09 | 79.45 |
| HPCL | 16999.28 | 1570.56 | 1438.94 | 1510.90 | 95.24 | 14641.48 | 13464.64 | 14150.26 | 95.15 |
| CPCL | 10290.00 | 920.00 | 917.46 | 946.86 | 96.90 | 8530.00 | 6521.75 | 8572.12 | 76.08 |
| NRL | 2549.86 | 218.27 | 248.84 | 151.52 | 164.23 | 2134.44 | 2239.35 | 1911.00 | 117.18 |
| MRPL | 12074.42 | 1450.00 | 1419.84 | 1305.84 | 108.73 | 9324.42 | 8815.80 | 11452.22 | 76.98 |
| ONGC | 63.83 | 5.61 | 7.56 | 9.10 | 83.10 | 52.90 | 66.06 | 74.75 | 88.38 |
| JVs | 14772.00 | 1428.00 | 1495.73 | 1807.39 | 82.76 | 12031.00 | 14019.61 | 16776.48 | 83.57 |
| BORL | 7800.00 | 660.00 | 694.44 | 706.46 | 98.30 | 6520.00 | 4986.03 | 6527.48 | 76.39 |
| HMEL | 6972.00 | 768.00 | 801.29 | 1100.93 | 72.78 | 5511.00 | 9033.58 | 10249.00 | 88.14 |
| Private | 89515.16 | 7478.69 | 7109.20 | 7478.69 | 95.06 | 75002.17 | 65218.19 | 75002.17 | 86.96 |
| RIL | 68894.99 | 5726.64 | 5564.40 | 5726.64 | 97.17 | 57702.27 | 51174.65 | 57702.27 | 88.69 |
| NEL | 20620.18 | 1752.05 | 1544.80 | 1752.05 | 88.17 | 17299.90 | 14043.54 | 17299.90 | 81.18 |
| TOTAL | 251664.61 | 22438.82 | 21809.00 | 21679.18 | 100.60 | 209903.55 | 182170.49 | 212064.08 | 85.90 |
Note: Totals may not tally due to rounding off. *: Provisional
Figure 3: Crude Oil Processed (Crude Throughput)
3.1 CPSE Refineries’ crude oil processed during January, 2021 was 13204.07TMT which is 6.54% higher when compared with January, 2020 but 2.42% lower than the target for the month.Cumulative crude throughputby CPSE refineries during April-January, 2020-21 was 102932.70TMT which is 16.23% and 14.43% lower than target for the period and crude throughputduring corresponding period of last year respectively.Reasons for shortfall in production are as under:
- IOCL-Koyali: Crude processed regulated for low product demand due to COVID impact.
- IOCL-Digboi: Crude processed lower due to Delayed Coker Unit (DCU) unplanned decoking.
- IOCL-Panipat: Crude processed lower due Diesel Hydrodesulphurisation (DHDS) shutdown for catalyst replacement and low HSD demand.
- IOCL-Paradip: Crude processed lower due product demand and high Vacuum Gas Oil (VGO) stock.
- HPCL-Mumbai: Crude processed lower due to planned shutdown of secondary units Old Fluid Catalytic Cracking Unit (OFFCU) and New Fluid Catalytic Cracking Unit (NFCCU).
- HPCL-Visakh: Crude processed lower due to planned shutdown of secondary units Continuous Catalytic Reforming (CCR) and Diesel Hydrodesulphurisation (DHDS)
3.2 JV refineries’ crude oil processed during January, 2021 was 1495.73TMT which is 4.74% higher than the target for the month but 17.24% lower when compared with January, 2020. Cumulative crude throughput during April-January, 2020-21 was14019.61 TMT which is 16.53% higher than target for the period but16.43% lower when compare with the corresponding period of last year respectively.
3.3 Private refineries’ crude oil processed during January, 2021 was 7109.20TMT which is 4.94% lower than the corresponding month of last year. Cumulative crude throughputduring April-January, 2020-21 was 65218.19 TMT which is 13.04% lower than thecorresponding period of last year.
- Production of Petroleum Products
Production of Petroleum Products during January, 2021 was 22173.16 TMT which is 4.78% lower than the target for the month and 2.55% lower when compared with January, 2020. Cumulative production during April-January, 2020-21 was 191244.01 TMT which is 11.31% and 12.36% lower than target for the period and production during corresponding period of last year respectively. Unit-wise production of petroleum products is given at Annexure-V. Company-wise production for the month of January, 2021 and cumulatively for the period April-January, 2020-21 vis-à-Vis same period of last year has been shown in Table-4 and month-wise in Figure-4.
Figure 4: Monthly Refinery Production of Petroleum Products
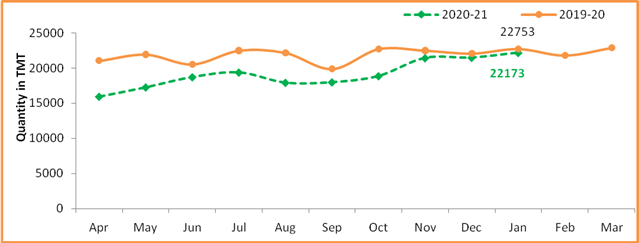
Table 4: Production of Petroleum Products (TMT)
| Oil Company | Target | January (Month) | April-January (Cumulative) | ||||||
| 2020-21 (Apr-Mar) | 2020-21 | 2019-20 | % over last year | 2020-21 | 2019-20 | % over last year | |||
| Target | Prod.* | Prod. | Target | Prod.* | Prod. | ||||
| CPSE | 138753.95 | 12662.75 | 12536.37 | 11777.85 | 106.44 | 115673.58 | 97481.04 | 113564.34 | 85.84 |
| IOCL | 68760.50 | 6183.40 | 6126.82 | 5494.48 | 111.51 | 57510.90 | 49048.49 | 55278.26 | 88.73 |
| BPCL | 31319.00 | 2695.00 | 2684.05 | 2762.61 | 97.16 | 26200.00 | 19835.98 | 24996.52 | 79.35 |
| HPCL | 15914.53 | 1462.24 | 1420.09 | 1366.29 | 103.94 | 13702.28 | 12580.33 | 13150.01 | 95.67 |
| CPCL | 9527.02 | 855.28 | 825.11 | 863.87 | 95.51 | 7890.10 | 5955.69 | 7847.31 | 75.89 |
| NRL | 2554.46 | 220.10 | 252.95 | 130.83 | 193.34 | 2132.64 | 2267.67 | 1833.03 | 123.71 |
| MRPL | 10618.44 | 1241.46 | 1220.14 | 1152.48 | 105.87 | 8187.93 | 7729.59 | 10390.40 | 74.39 |
| ONGC | 60.00 | 5.27 | 7.21 | 7.29 | 98.96 | 49.73 | 63.29 | 68.81 | 91.98 |
| JVs | 13590.40 | 1318.48 | 1378.92 | 1684.08 | 81.88 | 11058.56 | 13002.12 | 15674.19 | 82.95 |
| BORL | 6958.40 | 588.48 | 598.49 | 645.25 | 92.75 | 5816.56 | 4368.42 | 5958.81 | 73.31 |
| HMEL | 6632.00 | 730.00 | 780.43 | 1038.83 | 75.13 | 5242.00 | 8633.70 | 9715.38 | 88.87 |
| Private | 102154.50 | 8897.23 | 7907.34 | 8897.23 | 88.87 | 84993.43 | 77209.90 | 84993.43 | 90.84 |
| RIL | 82374.12 | 7158.33 | 6429.86 | 7158.33 | 89.82 | 68393.99 | 63602.59 | 68393.99 | 92.99 |
| NEL | 19780.38 | 1738.90 | 1477.48 | 1738.90 | 84.97 | 16599.45 | 13607.31 | 16599.45 | 81.97 |
| Total Refinery | 254498.86 | 22878.46 | 21822.63 | 22359.16 | 97.60 | 211725.57 | 187693.06 | 214231.96 | 87.61 |
| Fractionators | 4523.28 | 407.98 | 350.53 | 394.24 | 88.91 | 3895.58 | 3550.95 | 3985.80 | 89.09 |
| TOTAL | 259022.13 | 23286.44 | 22173.16 | 22753.40 | 97.45 | 215621.15 | 191244.01 | 218217.76 | 87.64 |
Note: Totals may not tally due to rounding off. *: Provisional
1. Production of petroleum Products by Oil’s Refineries during January, 2021 was 21822.63 TMT which is 4.61% lower than the target for the month and 2.40% lower when compared with January, 2020. Cumulative production of petroleum products by refineries during April-January, 2020-21 was 187693.06 TMT which is 11.35% and 12.39% lower than target for the period and production during corresponding period of last year respectively.
- Production of petroleum Products by Fractionators during January, 2021 was 350.53 TMT which is 14.08% lower than the target for the month and 11.09% lower when compared with January, 2020. Cumulative production by Fractionators during April-January, 2020-21 was 3550.95 TMT which is 8.85% and 10.91% lower than target for the period and production during corresponding period of last year respectively.