BrightView Reports First Quarter Fiscal 2023 Results
- Total revenue of $655.9 million, reflects year-over-year growth of 10.8%, including 5.5% total organic growth.
- Maintenance organic revenue growth of 1.5%, seventh consecutive quarter of land organic growth.
- Development organic revenue growth of 5.9%, reflecting continuation of solid growth.
- Net Loss of $18.9 million compared to prior year Net Loss of $12.8 million, reflecting a 70-basis point contraction of Net Loss margin.
- Adjusted EBITDA of $48.6 million, reflects a 20-basis point Adjusted EBITDA margin expansion and year-over-year growth of 14.1%.
Company Provides Second Quarter Guidance
- Second Quarter Total Revenue of $610 – $650 million, and Adjusted EBITDA of $33 – $43 million.
Adjusted EBITDA is a non-GAAP measure. Refer to the “Non-GAAP Financial Measures” section for more information. The Company is not providing a quantitative reconciliation of its financial outlook for Adjusted EBITDA to net (loss), its corresponding GAAP measure, because the GAAP measure that is excluded from its non-GAAP financial outlook is difficult to reliably predict or estimate without unreasonable effort due to its dependence on future uncertainties, such as items discussed below. Additionally, information that is currently not available to the Company could have a potentially unpredictable and potentially significant impact on its future GAAP financial results.
BLUE BELL, Pa.–(BUSINESS WIRE)–BrightView Holdings, Inc. (NYSE: BV) (the “Company” or “BrightView”), the leading commercial landscaping services company in the United States, today reported unaudited results for the first quarter ended December 31, 2022.

![]()
“We are pleased to start fiscal 2023 with a strong first quarter, underpinned by robust organic revenue growth across both segments, acquisition benefits, disciplined cost management and a steadfast focus on executing our growth strategy to continue to drive momentum in our business,” said Andrew Masterman, BrightView President and Chief Executive Officer. “Our performance is powered by the hard work and dedication of our team members, and I am very thankful for their efforts. Looking ahead, our priority is clear, we will continue to execute on our growth plans to deliver solid organic growth in fiscal 2023, while implementing initiatives designed to mitigate against externally driven headwinds and improve our profitability.”
Adjusted EBITDA, Adjusted EBITDA Margin, Adjusted Net (Loss) Income, Free Cash Flow and Adjusted (Loss) Earnings per Share are non-GAAP measures. Refer to the “Non-GAAP Financial Measures” and “Reconciliation of GAAP to Non-GAAP Financial Measures” sections for more information.
Fiscal 2023 Results – Total BrightView
| Total BrightView – Operating Highlights | |||||||||||
|
|
| Three Months Ended |
| ||||||||
| ($ in millions, except per share figures) |
| 2022 |
|
| 2021 |
|
| Change |
| ||
| Revenue |
| $ | 655.9 |
|
| $ | 591.8 |
|
| 10.8% |
|
| Net (Loss) |
| $ | (18.9 | ) |
| $ | (12.8 | ) |
| 47.7% |
|
| Net (Loss) Margin |
|
| (2.9 | %) |
|
| (2.2 | %) |
| (70) bps |
|
| Adjusted EBITDA |
| $ | 48.6 |
|
| $ | 42.6 |
|
| 14.1% |
|
| Adjusted EBITDA Margin |
|
| 7.4 | % |
|
| 7.2 | % |
| 20 bps |
|
| Adjusted Net (Loss) Income |
| $ | (1.2 | ) |
| $ | 8.2 |
|
| (114.6%) |
|
| Basic (Loss) per Share |
| $ | (0.20 | ) |
| $ | (0.12 | ) |
| 66.7% |
|
| Adjusted (Loss) Earnings per Share |
| $ | (0.01 | ) |
| $ | 0.08 |
|
| (112.5%) |
|
| Weighted average number of common shares outstanding |
|
| 93.3 |
|
|
| 105.3 |
|
| (11.4%) |
|
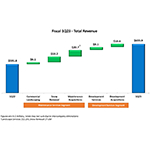
For the first quarter of fiscal 2023, total revenue increased 10.8% to $655.9 million driven by $32.8 million from organic growth, or 5.5% of the total percentage increase year-over-year, and $31.3 million from acquired business, or 5.3% of the total percentage increase year-over-year. Net Loss was $18.9 million compared to Net Loss of $12.8 million in the prior year period. Total Adjusted EBITDA increased $6.0 million, or 14.1%, to $48.6 million from $42.6 million in the prior year period.
Fiscal 2023 Results – Segments
| Maintenance Services – Operating Highlights | |||||||||||
|
|
| Three Months Ended |
| ||||||||
| ($ in millions) |
| 2022 |
|
| 2021 |
|
| Change |
| ||
| Landscape Maintenance |
| $ | 421.4 |
|
| $ | 402.2 |
|
| 4.8% |
|
| Snow Removal |
| $ | 61.8 |
|
| $ | 36.0 |
|
| 71.7% |
|
| Total Revenue |
| $ | 483.2 |
|
| $ | 438.2 |
|
| 10.3% |
|
| Adjusted EBITDA |
| $ | 50.5 |
|
| $ | 45.3 |
|
| 11.5% |
|
| Adjusted EBITDA Margin |
|
| 10.5 | % |
|
| 10.3 | % |
| 20 bps |
|
| Capital Expenditures |
| $ | 24.0 |
|
| $ | 21.9 |
|
| 9.6% |
|
For the first quarter of fiscal 2023, revenue in the Maintenance Services Segment increased by $45.0 million, or 10.3%, from the prior year as a result of three primary drivers. First, an increase of $6.1 million in underlying organic commercial landscape services underpinned by a combination of contract services and ancillary services growth. This increase reflects Maintenance land organic revenue growth of 1.5%, the seventh consecutive quarter of land organic growth. Second, a $20.7 million revenue contribution from acquired businesses, including $13.1 million in commercial landscape services and $7.6 million in snow removal. Third, an $18.2 million organic revenue increase in snow removal services, primarily due to lower snowfall in the prior period (relative to the 10-year historical average as defined by NOAA1 for the Company’s footprint during the respective three-month periods).
Adjusted EBITDA for the Maintenance Services Segment for the three months ended December 31, 2022 increased by $5.2 million to $50.5 million from $45.3 million in the 2021 period. Segment Adjusted EBITDA Margin increased 20 basis points, to 10.5%, in the three months ended December 31, 2022, from 10.3% in the 2021 period. The increases in Segment Adjusted EBITDA and Segment Adjusted EBITDA Margin were principally driven by the increases in organic underlying commercial landscape services revenues and snow removal services revenues, partially offset by increased compensation-related costs.
| Development Services – Operating Highlights | |||||||||||
|
|
| Three Months Ended |
| ||||||||
| ($ in millions) |
| 2022 |
|
| 2021 |
|
| Change |
| ||
| Revenue |
| $ | 174.4 |
|
| $ | 154.7 |
|
| 12.7% |
|
| Adjusted EBITDA |
| $ | 16.5 |
|
| $ | 14.5 |
|
| 13.8% |
|
| Adjusted EBITDA Margin |
|
| 9.5 | % |
|
| 9.4 | % |
| 10 bps |
|
| Capital Expenditures |
| $ | 2.0 |
|
| $ | 1.1 |
|
| 81.8% |
|
For the first quarter of fiscal 2023, revenue in the Development Services Segment increased by $19.7 million, or 12.7%, compared to the prior year. The increase was principally driven by $10.6 million of revenue contributions from acquired businesses coupled with an increase in Development Services project volumes of $9.1 million.
Adjusted EBITDA for the Development Services Segment for the three months ended December 31, 2022 increased $2.0 million, to $16.5 million, compared to the 2021 period. Segment Adjusted EBITDA Margin increased 10 basis points, to 9.5% for the quarter from 9.4% in the prior year. The increases in Segment Adjusted EBITDA and Segment Adjusted EBITDA Margin were primarily driven by the increased Development Services Segment revenues, which were partially offset by increased costs associated with the mix of projects relative to the prior year.
| 1National Oceanic and Atmospheric Administration, U.S. Department of Commerce |
| Total BrightView Cash Flow Metrics | ||||||||||
|
|
| Three Months Ended | ||||||||
| ($ in millions) |
| 2022 |
|
| 2021 |
|
| Change | ||
| Net Cash (Used) by Operating Activities |
| $ | (29.6 | ) |
| $ | (22.4 | ) |
| 32.1% |
| Free Cash Flow |
| $ | (55.4 | ) |
| $ | (49.9 | ) |
| 11.0% |
| Capital Expenditures |
| $ | 27.2 |
|
| $ | 28.6 |
|
| (4.9%) |
Net cash used by operating activities for the three months ended December 31, 2022 increased $7.2 million, to $29.6 million, from $22.4 million in the prior year. This increase was due to a decrease in the cash provided by unbilled and deferred revenue coupled with an increase in cash used by accounts receivable. This was partially offset by a decrease in cash used by other operating assets coupled with a decrease in cash used by accounts payable and other operating liabilities.
Free Cash Flow decreased $5.5 million to an outflow of $55.4 million for the three months ended December 31, 2022 from an outflow of $49.9 million in the prior year. The decrease in Free Cash Flow was due to the increase in net cash used by operating activities described above, partially offset by a decrease in cash used for capital expenditures as described below.
For the three months ended December 31, 2022, capital expenditures were $27.2 million, compared with $28.6 million in the prior year. The Company also generated proceeds from the sale of property and equipment of $1.4 million and $1.1 million during the three months ended December 31, 2022 and 2021, respectively. Net of the proceeds from the sale of property and equipment, net capital expenditures represented 3.9% of revenue in the three months ended December 31, 2022, a decrease of 70 bps compared to 4.6% for the three months ended December 31, 2021.
| Total BrightView Balance Sheet Metrics |
| |||||||||||
| ($ in millions) |
| December 31, |
|
| September 30, |
|
| December 31, |
| |||
| Long-term debt, net |
| $ | 1,409.5 |
|
| $ | 1,330.7 |
|
| $ | 1,204.0 |
|
| Total Financial Debt1 |
| $ | 1,476.5 |
|
| $ | 1,395.0 |
|
| $ | 1,248.6 |
|
| Minus: |
|
|
|
|
|
|
|
|
| |||
| Total Cash & Equivalents |
|
| 22.4 |
|
|
| 20.1 |
|
|
| 132.8 |
|
| Total Net Financial Debt2 |
| $ | 1,454.1 |
|
| $ | 1,374.9 |
|
| $ | 1,115.8 |
|
| Total Net Financial Debt to Adjusted EBITDA ratio3 |
| 4.9x |
|
| 4.8x |
|
| 3.8x |
| |||
| 1Total Financial Debt includes total long-term debt, net of original issue discount, and finance lease obligations |
| |||||||||||
| 2Total Net Financial Debt equals Total Financial Debt minus Total Cash & Equivalents |
| |||||||||||
| 3Total Net Financial Debt to Adjusted EBITDA ratio equals Total Net Financial Debt divided by the trailing twelve month Adjusted EBITDA. |
| |||||||||||
As of December 31, 2022, the Company’s Total Net Financial Debt was $1,454.1 million, an increase of $79.2 million compared to $1,374.9 million as of September 30, 2022. This increase is consistent with the increase observed in the first quarter of the prior year. The Company’s Total Net Financial Debt to Adjusted EBITDA ratio was 4.9x and 4.8x as of December 31, 2022 and September 30, 2022, respectively.
Conference Call Information
A conference call to discuss the first quarter fiscal 2023 financial results is scheduled for February 7, 2023, at 10 a.m. ET. The U.S. toll free dial-in for the conference call is (844) 200-6205 and the international dial-in is (929) 526-1599. The Conference ID is 330386. A live audio webcast of the conference call will be available on the Company’s investor website https://investor.brightview.com, where presentation materials will be posted prior to the call.
A replay of the call will be available until 11:59 p.m. ET on February 14, 2023. To access the recording, dial (866) 813-9403 (Conference ID 891516).
About BrightView
BrightView (NYSE: BV), the nation’s largest commercial landscaper, proudly designs, creates, and maintains some of the best landscapes on Earth and provides the most efficient and comprehensive snow and ice removal services. With a dependable service commitment, BrightView brings brilliant landscapes to life at premier properties across the United States, including business parks and corporate offices, homeowners’ associations, healthcare facilities, educational institutions, retail centers, resorts and theme parks, municipalities, golf courses, and sports venues. BrightView also serves as the Official Field Consultant to Major League Baseball. Through industry-leading best practices and sustainable solutions, BrightView is invested in taking care of our team members, engaging our clients, inspiring our communities, and preserving our planet. Visit www.BrightView.com and connect with us on Twitter, Facebook, and LinkedIn.
Forward Looking Statements
This press release contains forward looking statements within the meaning of Section 27A of the Securities Act of 1933, as amended (the “Securities Act”) and Section 21E of the Securities Exchange Act of 1934 that involve substantial risks and uncertainties. All statements, other than statements of historical facts, contained in this presentation, including statements relating to our second quarter fiscal 2023 guidance and other statements related to our expectations regarding our industry, strategy, future operations, future liquidity and financial position, future revenues, projected costs, prospects, plans and objectives of management, are forward-looking statements. The words such as “outlook,” “guidance,” “projects,” “continues,” “believes,” “expects,” “may,” “will,” “should,” “seeks,” “intends,” “plans,” “estimates,” or “anticipates,” or the negative version of these words or similar expressions are intended to identify forward-looking statements, although not all forward-looking statements contain these identifying words. By their nature, forward-looking statements: speak only as of the date they are made; are not statements of historical fact or guarantees of future performance; and are subject to risks, uncertainties, assumptions, or changes in circumstances that are difficult to predict or quantify. Our expectations, beliefs, and projections are expressed in good faith and we believe there is a reasonable basis for them. However, there can be no assurance that management’s expectations, beliefs and projections will result or be achieved and actual results may vary materially from what is expressed in or indicated by the forward-looking statements. Factors that could cause actual results to differ materially from those projected include, but are not limited to: general business economic and financial conditions, including recessionary conditions; higher operational and supply costs and expenses due to inflation, and our inability to pass higher costs and expenses onto our customers through price increases; competitive industry pressures; the failure to retain current customers, renew existing customer contracts and obtain new customer contracts; the failure to enter into profitable contracts, or maintaining customer contracts that are unprofitable; a determination by customers to reduce their outsourcing or use of preferred vendors; the dispersed nature of our operating structure; our ability to implement our business strategies and achieve our growth objectives; the possibility that the anticipated benefits from our business acquisitions will not be realized in full or at all or may take longer to realize than expected; the possibility that costs or difficulties related to the integration of acquired businesses’ operations will be greater than expected and the possibility that integration efforts will disrupt our business and strain management time and resources; the seasonal nature of our landscape maintenance services; our dependence on weather conditions and the impact of severe weather and climate change on our business; increases in prices for raw materials, labor and fuel caused by rising inflation or otherwise; disruptions in our supply chain and changes in our ability to source adequate supplies and materials in a timely manner; the duration and extent of the novel coronavirus (COVID-19) pandemic and its resurgence, and the impact of federal, state and local governmental actions and customer behavior in response to the pandemic, including possible additional or reinstated restrictions as a result of a resurgence of the pandemic; any failure to accurately estimate the overall risk, requirements, or costs when we bid on or negotiate contracts that are ultimately awarded to us; the conditions and periodic fluctuations of real estate markets, including residential and commercial construction; our ability to retain or hire our executive management and other key personnel; our ability to attract and retain field and hourly employees, trained workers and third-party contractors and re-employ seasonal workers; any failure to properly verify employment eligibility of our employees; subcontractors taking actions that harm our business; our recognition of future impairment charges; laws and governmental regulations, including those relating to employees, wage and hour, immigration, human health and safety and transportation; environmental, health and safety laws and regulations, including regulatory costs, claims and litigation related to the use of chemicals and pesticides by employees and related third-party claims; our ability to pursue and achieve our environmental, social and corporate governance (ESG) focus area goals; unexpected delays, difficulties, and expenses encountered or incurred in pursuing our ESG goals and costs and requirements imposed as a result of maintaining the requirement of being a public company; the distraction and impact caused by litigation, of adverse litigation judgments and settlements resulting from legal proceedings; increase in on-job accidents involving employees; any failure, inadequacy, interruption, security failure or breach of our information technology systems; our ability to adequately protect our intellectual property; restrictions imposed by our debt agreements that limit our flexibility in operating our business; our ability to generate sufficient cash flow to satisfy our significant debt service obligations; our ability to obtain additional financing to fund future working capital, capital expenditures, investments or acquisitions, or other general corporate requirements; increases in interest rates governing our variable rate indebtedness increasing the cost of servicing our substantial indebtedness including changes related to LIBOR reform; any future sales, or the perception of future sales, by us or our affiliates, which could cause the market price for our common stock to decline;; the ability of KKR BrightView Aggregator L.P., who hold approximately 54% of our shares as of December 31, 2022, to exert significant influence over us; occurrence of natural disasters, terrorist attacks, geopolitical events, hostilities or other external events; changes in generally accepted accounting principles in the United States; and costs and requirements imposed as a result of maintaining compliance with the requirement of being a public company. Additional factors that could cause our results to differ materially from those described in the forward-looking statements can be found under “Item 1A. Risk Factors” in our Form 10-K for the fiscal year ended September 30, 2022 as such factors may be updated from time to time in our periodic filings with the Securities and Exchange Commission (the “SEC”), which are accessible on the SEC’s website at www.sec.gov. Accordingly, there are or will be important factors that could cause actual outcomes or results to differ materially from those indicated in these statements. These factors should not be construed as exhaustive and should be read in conjunction with the other cautionary statements that are included in this release and in our filings with the SEC. Any forward-looking statement made in this press release speaks only as of the date on which it was made. We undertake no obligation to publicly update or review any forward-looking statement, whether as a result of new information, future developments or otherwise, except as required by law.
Non-GAAP Financial Measures
To supplement the Company’s financial information presented in accordance with GAAP and aid understanding of the Company’s business performance, the Company uses certain non-GAAP financial measures, namely “Adjusted EBITDA”, “Adjusted EBITDA Margin”, “Adjusted Net (Loss) Income”, “Adjusted (Loss) Earnings per Share”, “Free Cash Flow”, “Total Financial Debt”, “Total Net Financial Debt” and “Total Net Financial Debt to Adjusted EBITDA ratio”. We believe Adjusted EBITDA, Adjusted EBITDA Margin, Adjusted Net (Loss) Income, Adjusted (Loss) Earnings per Share, Free Cash Flow, Total Financial Debt, Total Net Financial Debt, and Total Net Financial Debt to Adjusted EBITDA ratio assist investors in comparing our results across reporting periods on a consistent basis by excluding items that we do not believe are indicative of our core operating performance. Management believes these non-GAAP financial measures are useful to investors in highlighting trends in our operating performance, while other measures can differ significantly depending on long-term strategic decisions regarding capital structure, the tax jurisdictions in which we operate and capital investments. Management regularly uses these measures as tools in evaluating our operating performance, financial performance and liquidity. Management uses Adjusted EBITDA, Adjusted EBITDA Margin, Adjusted Net (Loss) Income, Adjusted (Loss) Earnings per Share, Free Cash Flow, Total Financial Debt, Total Net Financial Debt, and Total Net Financial Debt to Adjusted EBITDA ratio to supplement comparable GAAP measures in the evaluation of the effectiveness of our business strategies, to make budgeting decisions, to establish discretionary annual incentive compensation and to compare our performance against that of other peer companies using similar measures. In addition, we believe that Adjusted EBITDA, Adjusted EBITDA Margin, Adjusted Net (Loss) Income, Adjusted (Loss) Earnings per Share, Free Cash Flow, Total Financial Debt, Total Net Financial Debt, and Total Net Financial Debt to Adjusted EBITDA ratio are frequently used by investors and other interested parties in the evaluation of issuers, many of which also present Adjusted EBITDA, Adjusted EBITDA Margin, Adjusted Net (Loss) Income, Adjusted (Loss) Earnings per Share, Free Cash Flow, Total Financial Debt, Total Net Financial Debt, and Total Net Financial Debt to Adjusted EBITDA ratio when reporting their results in an effort to facilitate an understanding of their operating and financial results and liquidity. Management supplements GAAP results with non-GAAP financial measures to provide a more complete understanding of the factors and trends affecting the business than GAAP results alone.
Adjusted EBITDA: We define Adjusted EBITDA as net income (loss) before interest, taxes, depreciation and amortization, as further adjusted to exclude certain non-cash, non-recurring and other adjustment items.
Adjusted EBITDA Margin: We define Adjusted EBITDA Margin as Adjusted EBITDA, defined above, divided by Net Service Revenues.
Adjusted Net (Loss) Income: We define Adjusted Net (Loss) Income as net income (loss) including interest and depreciation, and excluding other items used to calculate Adjusted EBITDA and further adjusted for the tax effect of these exclusions and the removal of the discrete tax items.
Adjusted (Loss) Earnings per Share: We define Adjusted (Loss) Earnings per Share as Adjusted Net (Loss) Income divided by the weighted average number of common shares outstanding for the period.
Free Cash Flow: We define Free Cash Flow as cash flows from operating activities less capital expenditures, net of proceeds from the sale of property and equipment.
Total Financial Debt: We define Total Financial Debt as total long-term debt, net of original issue discount, and finance/capital lease obligations.
Total Net Financial Debt: We define Total Net Financial Debt as Total Financial Debt minus total cash and cash equivalents.
Total Net Financial Debt to Adjusted EBITDA ratio: We define Total Net Financial Debt to Adjusted EBITDA ratio as Total Net Financial Debt divided by the trailing twelve month Adjusted EBITDA.
Adjusted EBITDA, Adjusted EBITDA Margin, Adjusted Net (Loss) Income, Adjusted (Loss) Earnings per Share, Free Cash Flow, Total Financial Debt, Total Net Financial Debt, and Total Net Financial Debt to Adjusted EBITDA ratio are not recognized terms under GAAP and should not be considered as an alternative to net income (loss) or the ratio of net income (loss) to net revenue as a measure of financial performance, cash flows provided by operating activities as a measure of liquidity, or any other performance measure derived in accordance with GAAP.
Contacts
Investor Relations
Faten Freiha, Vice President of Investor Relations
(484) 567-7148
[email protected]
News Media
David Freireich, Vice President of Communications & Public Affairs
(484) 567-7244
[email protected]