Anheuser-Busch InBev Reports Third Quarter 2022 Results
Best quarterly volume performance this year driven by accelerated digital transformation and continued consumer demand for our brand portfolio


BRUSSELS–(BUSINESS WIRE)–Anheuser-Busch InBev (Brussel:ABI) (BMV:ANB) (JSE:ANH) (NYSE:BUD):
Regulated and inside information1
“We delivered broad-based volume growth of 3.7% this quarter resulting in an accelerated increase in revenue of 12.1%. We continue to see strong consumer demand for our portfolio and a resilient beer category as we navigate the dynamic operating environment. As a result of our performance and continued momentum, we are raising the bottom-end of our FY22 EBITDA outlook.” – Michel Doukeris, CEO, AB InBev
Total Revenue
+ 12.1%
Revenue increased by 12.1% in 3Q22 with revenue per hl growth of 8.0% and by 11.5% in 9M22 with revenue per hl growth of 7.8%.
12.7% increase in combined revenues of our global brands, Budweiser, Stella Artois and Corona, outside of their respective home markets in 3Q22, and 9.6% in 9M22.
Approximately 57% of our revenue now through B2B digital platforms with the monthly active user base of BEES reaching 3.1 million users as of 30 September 2022.
Over 385 million USD of revenue and approximately 17 million ecommerce orders generated by our direct-to-consumer ecosystem in 3Q22.
Total Volume
+3.7%
In 3Q22, total volumes grew by 3.7% , with own beer volumes up by 3.4% and non-beer volumes up by 5.2% . In 9M22, total volumes grew by 3.3% with own beer volumes up by 2.8% and non-beer volumes up by 6.5%.
Normalized EBITDA
+ 6.5%
In 3Q22 normalized EBITDA of 5 313 million USD represents an increase of 6.5% with normalized EBITDA margin contraction of 183 bps to 35.2% . In 9M22, normalized EBITDA increased by 7.0% to 14 896 million USD and normalized EBITDA margin contracted by 143 bps to 34.5%. Normalized EBITDA figures of 9M22 and 9M21 include an impact of 201 million USD and 226 million USD from tax credits in Brazil that were recorded in 2Q22 and 2Q21 respectively. For more details, please see page 10.
Underlying Profit
1 682 million USD
Underlying profit (normalized profit attributable to equity holders of AB InBev excluding mark-to-market gains and losses linked to the hedging of our share-based payment programs and the impact of hyperinflation) was 1 682 million USD in 3Q22 compared to 1 699 million USD in 3Q21 and was 4 354 million USD in 9M22 compared to 4 290 million USD in 9M21.
Underlying EPS
0.84 USD
Underlying EPS was 0.84 USD in 3Q22, a decrease from 0.85 USD in 3Q21 and was 2.16 USD in 9M22, an increase from 2.14 USD in 9M21.
1The enclosed information constitutes inside information as defined in Regulation (EU) No 596/2014 of the European Parliament and of the Council of 16 April 2014 on market abuse, and regulated information as defined in the Belgian Royal Decree of 14 November 2007 regarding the duties of issuers of financial instruments which have been admitted for trading on a regulated market. For important disclaimers and notes on the basis of preparation, please refer to page 14.
Management comments
Best quarterly volume performance this year driven by accelerated digital transformation and continued consumer demand for our brand portfolio
Our volume momentum accelerated this quarter as we delivered 3.7% growth, even in the context of the ongoing dynamic operating environment. Top-line grew by 12.1% with 8.0% revenue per hl growth, driven by revenue management initiatives and continued premiumization across most of our markets. EBITDA increased by 6.5% as our top-line growth was partially offset by anticipated transactional FX and commodity cost headwinds and increased sales and marketing investments in our brands.
Following the recognition of our brand building and creative marketing capabilities at the Cannes Lions International Festival of Creativity, we were honored to be named the World’s Most Effective Marketer in the Global Effie Effectiveness Index for the first time in our company history.
As we continue on our deleveraging path, our bond portfolio maintains a very manageable weighted average pre-tax coupon rate of approximately 4% with 94% of the portfolio fixed rate. The weighted average maturity remains more than 16 years with no near- or medium-term refinancing requirements.
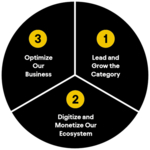
Consistent execution of our strategy
We continue to execute on and invest in three key strategic pillars to deliver consistent growth and long-term value creation.
See Image 1.
1. Lead and grow the category:
This quarter we delivered a broad-based total volume increase of 3.7% with growth in more than 60% of our markets.
2. Digitize and monetize our ecosystem:
BEES is now live in 19 markets and has reached 3.1 million monthly active users as of 30 September 2022, a 7% increase versus 2Q22. BEES Marketplace is now live in 14 markets with 44% of BEES customers now also Marketplace buyers.
3. Optimize our business:
In 9M22, our EBITDA grew by 7.0% and, as a result of deleveraging, our net interest expense decreased by approximately 200 million USD versus 9M21.
1. Lead and grow the category:
We are executing on five proven and scalable levers to drive category expansion:
- Inclusive Category: In 3Q22, consumer participation with our portfolio increased in most of our focus markets, according to our estimates, driven by brand, pack and liquid innovations focused on expanding inclusivity and accessibility. For example, in Mexico, our pack size initiatives across both upsizing and downsizing grew strong double-digits this quarter, contributing over 1 million hl’s in volume and improving profitability in both the core and above core segments of our portfolio.
- Core Superiority: In 3Q22, our mainstream portfolio continued to outperform the industry across the majority of our focus markets, according to our estimates, and delivered low-teens revenue growth, led by particularly strong performances in Mexico, Brazil and South Africa.
- Occasions Development: Our global non-alcohol beer portfolio delivered double-digit revenue growth this quarter led by Budweiser Zero and Stella Artois Liberté in the US.
- Premiumization: Our above core portfolio grew revenue by low-teens this quarter, led by continued double-digit growth of Michelob ULTRA in the US and Mexico and further expansion of Spaten in Brazil. Our global brands grew revenue by 12.7% outside of their home markets this quarter, led by Corona with 23.5% growth. Budweiser grew by 8.9% despite the impact of COVID-19 restrictions in China, the brand’s largest market. Stella Artois grew by 7.0% with continued growth in focus markets such as the US and Brazil.
- Beyond Beer: Our global Beyond Beer business grew revenue by over 10% this quarter, contributing more than 400 million USD of revenue. In the US, within the spirits-based ready-to-drink segment, our portfolio continued to grow strong double-digits, ahead of the industry, led by Cutwater and NÜTRL vodka seltzer. In South Africa, Brutal Fruit and Flying Fish delivered continued double-digit volume growth.
2. Digitize and monetize our ecosystem
- Digitizing our relationships with our more than 6 million customers globally: As of 30 September 2022, BEES is live in 19 markets with approximately 57% of our revenues now through B2B digital platforms. In 3Q22, BEES reached 3.1 million monthly active users and captured approximately 7.7 billion USD in gross merchandise value (GMV), growth of over 40% versus 3Q21. BEES Marketplace is now live in 14 markets and generated September annualized revenues from sales of third party products of approximately 850 million USD. As of September 2022, 44% of BEES customers were also Marketplace buyers.
- Leading the way in DTC solutions: Our digital direct-to-consumer (DTC) products, Ze Delivery, TaDa and PerfectDraft are now available in 17 markets and generated over 100 million USD in revenue and 17 million orders in the quarter. Our network of physical retail products, such as Modelorama in Mexico and Pit Stop in Brazil, continued to deliver revenue growth across our footprint of approximately 13 000 stores. Combined, our omni-channel DTC ecosystem of digital and physical DTC products generated revenue of over 1 billion USD in 9M22, mid-teens growth versus 9M21.
3. Optimize our business
In 9M22, we continued to focus on disciplined resource allocation and delivered 7.0% EBITDA growth. Our bond portfolio maintains a very manageable weighted average pre-tax coupon rate of approximately 4% with 94% of the portfolio fixed rate. Our net interest expense for 9M22 decreased by approximately 200 million USD versus 9M21, principally as a result of our gross debt reduction efforts.
Advancing our ESG priorities
As we continue to advance our sustainability agenda, we were proud to recently be included on Fortune’s Change the World List in recognition of our global initiatives in water stewardship. We are also making progress towards our ambition to achieve net zero by 2040, reaching carbon neutrality at five facilities in Brazil and one in Argentina in 9M22.
Creating a future with more cheers
Through the implementation of our category expansion levers, we continue to lead and grow the beer category resulting in broad-based volume growth of 3.7% this quarter. We are digitizing and monetizing our ecosystem with 57% of our revenue now through digital channels and we continue to optimize our business through efficient resource allocation and dynamically balancing our capital allocation priorities to drive long-term value creation. We remain focused on the consistent execution of our strategy and ESG priorities to generate value for our stakeholders and deliver on our purpose to create a future with more cheers.
2022 Outlook
- Overall Performance: We expect our FY22 EBITDA to grow between 6-8% and our revenue to grow ahead of EBITDA from a healthy combination of volume and price. Our medium-term outlook, which aims to deliver EBITDA growth of 4-8%, remains unchanged.
- Net Finance Costs: Net pension interest expenses and accretion expenses are expected to be in the range of 170 to 200 million USD per quarter, depending on currency and interest rate fluctuations. We expect the average gross debt coupon in FY22 to be approximately 4.0%. Net finance costs will continue to be impacted by any gains and losses related to the hedging of our share-based payment programs.
- Effective Tax Rates (ETR): We expect the normalized ETR in FY22 to be in the range of 28% to 30% excluding any gains and losses relating to the hedging of our share-based payment programs. The ETR outlook does not consider the impact of potential future changes in legislation.
- Net Capital Expenditure: We expect net capital expenditure of between 4.5 and 5.0 billion USD in FY22.
| Figure 1. Consolidated performance (million USD) | |||
| 3Q21 | 3Q22 | Organic | |
| growth | |||
| Total Volumes (thousand hls) | 151 629 | 157 284 | 3.7% |
| AB InBev own beer | 131 354 | 137 796 | 3.4% |
| Non-beer volumes | 19 308 | 18 332 | 5.2% |
| Third party products | 968 | 1 156 | 19.4% |
| Revenue | 14 274 | 15 091 | 12.1% |
| Gross profit | 8 236 | 8 232 | 6.2% |
| Gross margin | 57.7% | 54.5% | -300 bps |
| Normalized EBITDA | 5 214 | 5 313 | 6.5% |
| Normalized EBITDA margin | 36.5% | 35.2% | -183 bps |
| Normalized EBIT | 4 020 | 4 055 | 4.4% |
| Normalized EBIT margin | 28.2% | 26.9% | -195 bps |
|
| |||
| Profit attributable to equity holders of AB InBev | 250 | 1 433 | |
| Normalized profit attributable to equity holders of AB InBev | 1 002 | 1 629 | |
| Underlying profit attributable to equity holders of AB InBev | 1 699 | 1 682 | |
|
| |||
| Earnings per share (USD) | 0.12 | 0.71 | |
| Normalized earnings per share (USD) | 0.50 | 0.81 | |
| Underlying earnings per share (USD) | 0.85 | 0.84 | |
| . | |||
| . | |||
| 9M21 | 9M22 | Organic | |
| growth | |||
| Total Volumes (thousand hls) | 432 027 | 446 358 | 3.3% |
| AB InBev own beer | 378 989 | 389 488 | 2.8% |
| Non-beer volumes | 50 551 | 53 820 | 6.5% |
| Third party products | 2 487 | 3 050 | 22.6% |
| Revenue | 40 106 | 43 118 | 11.5% |
| Gross profit | 23 105 | 23 475 | 5.9% |
| Gross margin | 57.6% | 54.4% | -286 bps |
| Normalized EBITDA | 14 327 | 14 896 | 7.0% |
| Normalized EBITDA margin | 35.7% | 34.5% | -143 bps |
| Normalized EBIT | 10 788 | 11 160 | 5.9% |
| Normalized EBIT margin | 26.9% | 25.9% | -134 bps |
|
| |||
| Profit attributable to equity holders of AB InBev | 2 708 | 3 126 | |
| Normalized profit attributable to equity holders of AB InBev | 3 926 | 4 489 | |
| Underlying profit attributable to equity holders of AB InBev | 4 290 | 4 354 | |
|
| |||
| Earnings per share (USD) | 1.35 | 1.55 | |
| Normalized earnings per share (USD) | 1.96 | 2.23 | |
| Underlying earnings per share (USD) | 2.14 | 2.16 |
|
| Figure 2. Volumes (thousand hls) | ||||||
| 3Q21 | Scope | Organic | 3Q22 | Organic growth | ||
| growth | Total Volume | Own beer volume | ||||
| North America | 28 137 | 1 | -362 | 27 775 | -1.3% | -1.7% |
| Middle Americas | 35 591 | 19 | 1 705 | 37 314 | 4.8% | 6.0% |
| South America | 39 399 | 106 | 1 140 | 40 644 | 2.9% | 0.4% |
| EMEA | 22 124 | 24 | 1 576 | 23 724 | 7.1% | 7.3% |
| Asia Pacific | 26 020 | 1 | 1 589 | 27 610 | 6.1% | 6.1% |
| Global Export and Holding Companies | 360 | -150 | 8 | 217 | 3.7% | -0.1% |
| AB InBev Worldwide | 151 629 | – | 5 655 | 157 284 | 3.7% | 3.4% |
| . | ||||||
| 9M21 | Scope | Organic | 9M22 | Organic growth | ||
| growth | Total Volume | Own beer volume | ||||
| North America | 81 389 | 1 | -2 166 | 79 223 | -2.7% | -2.6% |
| Middle Americas | 103 570 | 41 | 5 727 | 109 338 | 5.5% | 6.6% |
| South America | 111 327 | 257 | 5 875 | 117 459 | 5.3% | 2.5% |
| EMEA | 62 665 | 53 | 3 968 | 66 686 | 6.3% | 6.3% |
| Asia Pacific | 72 101 | 2 | 891 | 72 995 | 1.2% | 1.3% |
| Global Export and Holding Companies | 975 | -354 | 36 | 657 | 5.8% | 4.2% |
| AB InBev Worldwide | 432 027 | – | 14 331 | 446 358 | 3.3% | 2.8% |
Key Market Performances
United States: Continued top-line growth driven by our above core portfolio
- Operating performance:
- 3Q22: Revenue grew by 1.9% with revenue per hl increasing by 3.8%. Sales-to-wholesalers (STWs) were down by 1.8% and sales-to-retailers (STRs) declined by 1.7%, estimated to be below the industry, with September volumes benefitting from shipment phasing ahead of our October price increase. EBITDA declined by 2.0%.
- 9M22: Top line grew by 2.2% with revenue per hl growth of 5.1%. Our STWs were down by 2.7% and STR’s declined by 3.1%. EBITDA decreased by 0.9%.
- 3Q22: Revenue grew by 1.9% with revenue per hl increasing by 3.8%. Sales-to-wholesalers (STWs) were down by 1.8% and sales-to-retailers (STRs) declined by 1.7%, estimated to be below the industry, with September volumes benefitting from shipment phasing ahead of our October price increase. EBITDA declined by 2.0%.
- Commercial highlights: The beer industry remains resilient even in the context of an ongoing inflationary environment. We continue to progress on our commercial strategy to rebalance our portfolio with our above core beer and Beyond Beer brands now generating approximately 40% of our revenue. Our above core beer portfolio outperformed the industry this quarter, led by Michelob ULTRA which grew by double-digits and complemented by growth in Stella Artois, Kona Big Wave and Estrella Jalisco. In Beyond Beer, our spirits-based ready-to-drink portfolio continued to outperform the industry, led by Cutwater, the #1 spirits-based cocktail in the country, and NÜTRL vodka seltzer which both grew strong double-digits.
Mexico: Double-digit top- and bottom-line growth with accelerated market share gain
- Operating performance:
- 3Q22: Revenue grew by mid-twenties with revenue per hl growth of mid-teens, driven by revenue management initiatives and premiumization. Our volumes grew by more than 10% as we continued to outperform the industry. EBITDA grew by low-twenties.
- 9M22: Top-line grew by high-teens with high-single digit volume and revenue per hl growth of more than 10%. EBITDA increased by mid-teens.
- 3Q22: Revenue grew by mid-twenties with revenue per hl growth of mid-teens, driven by revenue management initiatives and premiumization. Our volumes grew by more than 10% as we continued to outperform the industry. EBITDA grew by low-twenties.
- Commercial highlights: We delivered volume growth across all segments of our portfolio this quarter, with our above core portfolio delivering growth in the high-twenties, led by Modelo, Pacifico and Michelob Ultra. We continued to develop our distribution footprint, expanding into over 800 additional Oxxo stores this quarter with the rollout now approximately 80% complete. BEES continues to expand, with approximately 86% of our revenues now digital and 60% of our BEES customers now also BEES Marketplace buyers.
Colombia: Double-digit top-line growth with record high per capita consumption
- Operating performance:
- 3Q22: Revenue grew by high-teens with high-single digit volume and low-teens revenue per hl growth, driven by revenue management initiatives and premiumization. EBITDA grew by high-single digits.
- 9M22: Revenue grew by low-twenties with volume increasing by high-single digits and revenue per hl growth of low-teens. EBITDA grew by low-teens.
- 3Q22: Revenue grew by high-teens with high-single digit volume and low-teens revenue per hl growth, driven by revenue management initiatives and premiumization. EBITDA grew by high-single digits.
- Commercial highlights: Led by the consistent implementation of our category expansion levers, we delivered volume growth across all segments of our portfolio this quarter. Our premium and super premium portfolio continued to lead the way, delivering high-teens volume growth and reaching an all-time high volume and share of our total revenue. More than 30% of our BEES customers are now also BEES Marketplace buyers.
Brazil: Double-digit top- and bottom-line growth with margin expansion
- Operating performance:
- 3Q22: Revenue grew by 20.1%, with volume growth of 2.4% and revenue per hl growth of 17.3%. Our beer volumes were flat, as we cycled a strong performance in 3Q21. Non-beer volumes grew by 9.2%. EBITDA grew by 23.7% with margin expansion of 75bps.
- 9M22: Total volume grew by 5.9% with beer volumes up by 3.4% and non-beer volumes up by 13.9%. Revenue increased by 21.1%, with revenue per hl growth of 14.3%. EBITDA grew by 18.1%.
- 3Q22: Revenue grew by 20.1%, with volume growth of 2.4% and revenue per hl growth of 17.3%. Our beer volumes were flat, as we cycled a strong performance in 3Q21. Non-beer volumes grew by 9.2%. EBITDA grew by 23.7% with margin expansion of 75bps.
- Commercial highlights: Our premium and super premium brands continued to outperform this quarter, delivering high-single digit volume growth. Our core beer portfolio increased volumes by mid-single digits, and we continued to invest behind the development of our core plus brands. Non-beer volume growth was led by the performance of our premium and wellness brands. Over 70% of our BEES customers are now also BEES Marketplace buyers. Our digital DTC platform, Zé Delivery, fulfilled over 15 million orders in 3Q22, and has reached 4.3 million monthly active users.
Europe: Double-digit top-line growth offset by elevated cost pressures
- Operating performance:
- 3Q22: Revenue grew by double-digits, with mid-single digit volume and high-single digit revenue per hl growth, driven by ongoing demand for our premium brands, revenue management initiatives and on-premise recovery. EBITDA declined by mid-single digits, impacted by commodity cost headwinds and increased sales and marketing investments to support our premium strategy and FIFA World CupTM activations.
-
9M22: Revenue grew by low-teens with high-single digit revenue per hl and low-single digit volume growth. EBITDA increased by mid-single digits.
- 3Q22: Revenue grew by double-digits, with mid-single digit volume and high-single digit revenue per hl growth, driven by ongoing demand for our premium brands, revenue management initiatives and on-premise recovery. EBITDA declined by mid-single digits, impacted by commodity cost headwinds and increased sales and marketing investments to support our premium strategy and FIFA World CupTM activations.
-
Commercial highlights: We continue to premiumize our portfolio in Europe, with our global and super premium brands both delivering double-digit revenue growth this quarter. Led by the consistent execution of our strategy, in 9M22 we expanded or maintained market share in the majority of our key markets, according to our estimates. Our DTC product, PerfectDraft, expanded its shopper base by more than 20% versus 3Q21.
South Africa: Double-digit top- and bottom-line growth and additional investment in capacity to support growth
- Operating performance:
- 3Q22: Revenue grew by mid-twenties, with mid-single digit revenue per hl growth, primarily driven by revenue management initiatives. Our volumes grew by high-teens, driven by the execution of our category expansion levers and supported by a favorable comparable from a 25 day ban on alcohol sales in 3Q21. EBITDA grew by over 30%. Versus 3Q19, volumes grew by low-teens, ahead of the industry according to our estimates.
- 9M22: Revenue grew by more than 20% with mid-single digit revenue per hl growth and mid-teens increase in volume. EBITDA grew by high-twenties.
- 3Q22: Revenue grew by mid-twenties, with mid-single digit revenue per hl growth, primarily driven by revenue management initiatives. Our volumes grew by high-teens, driven by the execution of our category expansion levers and supported by a favorable comparable from a 25 day ban on alcohol sales in 3Q21. EBITDA grew by over 30%. Versus 3Q19, volumes grew by low-teens, ahead of the industry according to our estimates.
- Commercial highlights: We delivered growth across all segments of our portfolio this quarter, despite production capacity constraints limiting our ability to fully service consumer demand. We have invested in additional capacity which is expected to come on-line in 4Q22. Our performance was led by over 30% revenue growth in our leading core brand, Carling Black Label. Our premium, super premium and Beyond Beer portfolios all delivered a double-digit increase in volumes. Over 50% of BEES customers are now also BEES Marketplace users.
China: Underlying consumer demand remains consistent, though industry impacted by continued COVID-19 restrictions
- Operating performance:
- 3Q22: COVID-19 restrictions continued to disproportionately impact our key regions and sales channels. Our volumes grew by 3.6%. Revenue per hl declined by 1.9%, driven by negative channel and geographic mix, resulting in total revenue growth of 1.7%. EBITDA declined by 2.3%.
- 9M22: Volumes declined by 2.2% and revenue per hl grew by 0.7%, leading to total revenue decline of 1.6%. EBITDA declined by 5.1%
- Commercial highlights: We continue to invest behind our commercial strategy, focused on premiumization, channel and geographic expansion and digital transformation. In our expansion cities, excluding those impacted by restrictions, Budweiser and our super premium portfolio grew volumes by double-digits. Our BEES platform has expanded to more than 90 cities with over 10% of our revenue through digital channels in September.
Highlights from our other markets
- Canada: Our total volume outperformed the industry. Total revenue grew by high-single digits this quarter with volume growth of mid-single digits.
- Peru: Fueled by the consistent execution of our commercial strategy and ongoing portfolio transformation, we delivered record high volumes for the quarter. Revenue grew by low-teens with high-single digit revenue per hl and low-single digit volume growth. Over 50% of BEES customers are now also BEES Marketplace buyers.
- Ecuador: We delivered low-twenties revenue growth with a volume increase of low-teens this quarter, driven by continued expansion of the beer category and a favorable comparable from COVID-19 recovery. Over 60% of BEES customers are now also BEES Marketplace buyers.
- Argentina: Volumes grew by high-single digits this quarter, led by our core beer portfolio and global brands. Revenue per hl grew by double-digits, driven primarily by revenue management initiatives in a highly inflationary environment.
- Africa excluding South Africa: In Nigeria, our top-line grew by high-single digits this quarter, driven by revenue management initiatives, though volumes declined due to a soft industry and ongoing supply chain constraints. In our other key markets, we delivered double-digit revenue growth in 3Q22, driven by Tanzania, Zambia and Botswana. We are investing in additional capacity in Zambia to support growth.
- South Korea: Volumes grew by mid-teens this quarter, driven by our leading core brand ‘All New Cass’, continued market share gains and further improvement in the operating environment. Revenue per hl increased by mid-single digits resulting in double-digit revenue growth.
| Consolidated Income Statement | |||
| Figure 3. Consolidated income statement (million USD) | |||
| 3Q21 | 3Q22 | Organic | |
| growth | |||
| Revenue | 14 274 | 15 091 | 12.1% |
| Cost of sales | -6 039 | -6 860 | -20.0% |
| Gross profit | 8 236 | 8 232 | 6.2% |
| SG&A | -4 379 | -4 347 | -8.0% |
| Other operating income/(expenses) | 163 | 170 | 8.1% |
| Normalized profit from operations (normalized EBIT) | 4 020 | 4 055 | 4.4% |
| Non-underlying items above EBIT | -73 | -165 | |
| Net finance income/(cost) | -1 900 | -1 392 | |
| Non-underlying net finance income/(cost) | -747 | -65 | |
| Share of results of associates | 73 | 81 | |
| Income tax expense | -679 | -688 | |
| Profit | 695 | 1 825 | |
| Profit attributable to non-controlling interest | 444 | 392 | |
| Profit attributable to equity holders of AB InBev | 250 | 1 433 | |
|
| |||
| Normalized EBITDA | 5 214 | 5 313 | 6.5% |
| Normalized profit attributable to equity holders of AB InBev | 1 002 | 1 629 | |
| . | |||
| 9M21 | 9M22 | Organic | |
| growth | |||
| Revenue | 40 106 | 43 118 | 11.5% |
| Cost of sales | -17 001 | -19 644 | -19.0% |
| Gross profit | 23 105 | 23 475 | 5.9% |
| SG&A | -12 950 | -12 963 | -6.1% |
| Other operating income/(expenses) | 633 | 648 | 9.9% |
| Normalized profit from operations (normalized EBIT) | 10 788 | 11 160 | 5.9% |
| Non-underlying items above EBIT | -290 | -270 | |
| Net finance income/(cost) | -3 948 | -3 674 | |
| Non-underlying net finance income/(cost) | -1 046 | -51 | |
| Share of results of associates | 174 | 210 | |
| Non-underlying share of results of associates | – | -1 143 | |
| Income tax expense | -1 910 | -1 933 | |
| Profit | 3 768 | 4 299 | |
| Profit attributable to non-controlling interest | 1 061 | 1 174 | |
| Profit attributable to equity holders of AB InBev | 2 708 | 3 126 | |
|
| |||
| Normalized EBITDA | 14 327 | 14 896 | 7.0% |
| Normalized profit attributable to equity holders of AB InBev | 3 926 | 4 489 |
Contacts
Investors
Shaun Fullalove
Tel: +1 212 573 9287
E-mail: [email protected]
Maria Glukhova
Tel: +32 16 276 888
E-mail: [email protected]
Cyrus Nentin
Tel: +1 646 746 9673
E-mail: [email protected]
Media
Kate Laverge
Tel: +1 917 940 7421
E-mail: [email protected]
Ana Zenatti
Tel: +1 646 249 5440
E-mail: [email protected]
Fallon Buckelew
Tel: +1 310 592 6319
E-mail: [email protected]