INDIA’S MERCHANDISE TRADE: Preliminary Data August 2021

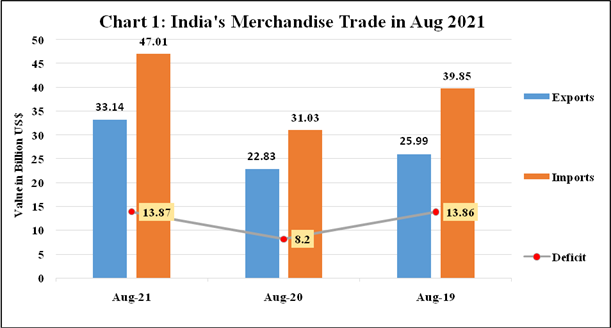
India’s merchandise exports in August 2021 was USD 33.14 billion, an increase of 45.17% over USD 22.83 billion in August 2020 and an increase of 27.5% over USD 25.99 billion in August 2019
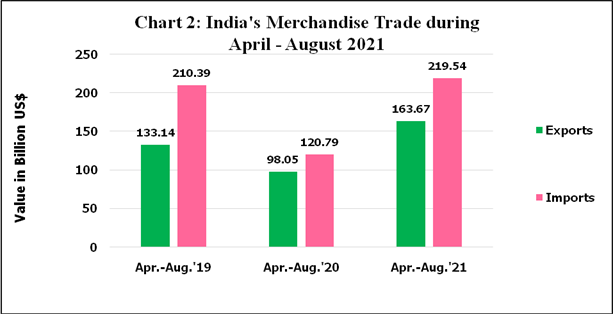
India’s merchandise exports in April-August 2021 was USD 163.67 billion, an increase of 66.92% over USD 98.05 billionin April-August 2020 and an increase of 22.93% over USD 133.14 billion in April-August 2019
India’s merchandise imports in August 2021 was USD 47.01 billion, an increase of 51.47% over USD 31.03 billion in August 2020 and an increase of 17.95% over USD 39.85 billion in August 2019.
India’s merchandise imports in April-August 2021 was USD 219.54 billion, an increase of 81.75% over USD 120.79 billion in April-August 2020 and a marginal increase of 4.35% over USD 210.39 billion in April-August 2019.
The trade deficit in August 2021 was USD 13.87 billion in compared to the trade deficit of USD 8.2 billion in August 2020, while it is USD 55.9 billion during April-August 2021 as compared to USD 22.7 billion during the same period of the previous year.
| Statement 1: India’s Merchandise Trade in August 2021 | |||||
| Value in Billion USD | % Growth | ||||
| Aug-21 | Aug-20 | Aug-19 | Aug-21 over Aug-20 | Aug-21 over Aug-19 | |
| Exports | 33.14 | 22.83 | 25.99 | 45.17 | 27.50 |
| Imports | 47.01 | 31.03 | 39.85 | 51.47 | 17.95 |
| Deficit | 13.87 | 8.20 | 13.86 | 69.15 | 0.07 |
| Statement 2: India’s Merchandise Trade in Apr-Aug 2021 | |||||
| Value in Billion USD | % Growth | ||||
| Apr-Aug21 | Apr-Aug20 | Apr-Aug19 | Apr-Aug 21 over Apr-Aug 20 | Apr-Aug 21 over Apr-Aug 19 | |
| Exports | 163.67 | 98.05 | 133.14 | 66.92 | 22.93 |
| Imports | 219.54 | 120.79 | 210.39 | 81.75 | 4.35 |
| Deficit | 55.87 | 22.74 | 77.25 | 145.69 | (-) 27.67 |
Value of non-petroleum exports in August 2021 was 28.58USD billion, registering a positive growth of 36.57% over non-petroleum exports of USD 20.93 billion in August 2020 and a positive growth of 25.44% over non-petroleum exports of USD 22.78 billion in August 2019.
Value of non-petroleum imports was USD 35.37 billion in August 2021 with a positive growth of 43.88% over non-petroleum imports of USD 24.58 billion in August 2020 and had a positive growth of 22.58% only over non-petroleum imports of USD 28.85 billion in August 2019.
| Statement 3: Merchandise Non-POL Trade in August 2021 | |||||
| Value in Billion USD | % Growth | ||||
| Aug21 | Aug20 | Aug19 | Aug21 over Aug20 | Aug21 over Aug19 | |
| Exports | 28.58 | 20.93 | 22.78 | 36.57 | 25.44 |
| Imports | 35.37 | 24.58 | 28.85 | 43.88 | 22.58 |
| Deficit | 6.79 | 3.65 | 6.07 | 86.03 | 11.86 |
The cumulative value of non-petroleum exports in April-August 2021 was USD 140.6 billion, an increase of 56.96% over USD 89.58 billion in April-August 2020 and an increase of 21.92% over USD 115.33 billion in April-August 2019.
The cumulative value of non-petroleum imports in April-August 2021 was USD 164.01 billion, showing an increase of 73.22% compared to non-oil imports of USD 94.68 billion in April-August 2020 and a marginal increase of 6.31% compared to non-oil imports of USD 154.28 billion in April-August 2019.
| Statement 4: Merchandise Non-POL Trade Apr-Aug 2021 | |||||
| Value in Billion USD | % Growth | ||||
| Apr-Aug21 | Apr-Aug20 | Apr-Aug19 | Apr-Aug21 over Apr-Aug20 | Apr-Aug21 over Apr-Aug19 | |
| Exports | 140.60 | 89.58 | 115.33 | 56.96 | 21.92 |
| Imports | 164.01 | 94.68 | 154.28 | 73.22 | 6.31 |
Value of non-petroleum and non-gems and jewellery exports in August 2021 was USD 25.15 billion, registering a positive growth of 31.66% over non-petroleum and non-gems and jewellery exports of USD 19.1 billion in August 2020 and a positive growth of 28.53% over non-petroleum and non-gems and jewellery exports of USD 19.57 billion in August 2019.
Value of non-oil, non-GJ (gold, silver & Precious metals) imports was USD 26.36 billion in August 2021 with a positive growth of 33.97%over non-oil and non-GJ imports of USD 19.68 billion in August 2020but had a marginal positivegrowth of 2.63% over non-oil and non-GJ imports of USD 25.69 billion in August 2019.
| Statement 5: Merchandise Non-POL Non-GJ Trade in August 2021 | |||||
| Value in Billion USD | % Growth | ||||
| Aug-21 | Aug-20 | Aug-19 | Aug21 over Aug20 | Aug21 over Aug19 | |
| Exports | 25.15 | 19.10 | 19.57 | 31.66 | 28.53 |
| Imports | 26.36 | 19.68 | 25.69 | 33.97 | 2.63 |
The cumulative value of non-petroleum and non-gems and jewellery exports in April-August 2021 was USD 124.55 billion, an increase of 49.0% over cumulative value of non-petroleum and non-gems and jewellery exports of USD 83.59 billion in April-August 2020 and an increase of 24.99% over cumulative value of non-petroleum and non-gems and jewellery exports of USD 99.65 billion in April-August 2019.
Non-oil, non-GJ (Gold, Silver & Precious Metals) imports was USD 132.94 billion in April-August 2021, recording a positive growth of 57.04%, as compared to non-oil and non-GJ imports of USD 84.66 billion in April-August 2020 and a marginal positive growth of 3.32% over USD 128.67 billion in April-August 2019.
| Statement 6: Merchandise Non-POL Non-GJ Trade Apr-Aug 2021 | |||||
| Value in Billion USD | % Growth | ||||
| Apr-Aug21 | Apr-Aug20 | Apr-Aug19 | Apr-Aug21 over Apr-Aug20 | Apr-Aug21 over Apr-Aug19 | |
| Exports | 124.55 | 83.59 | 99.65 | 49.00 | 24.99 |
| Imports | 132.94 | 84.66 | 128.67 | 57.04 | 3.32 |
Top 10 major commodity groups, covering more than 80% of total exports, have shown positive growth in August 2021 over corresponding month of previous year, as stated below.
| Statement 7: Exports of Top 10 Major Commodity Groups | ||||
| Value of Export (Million US$) | Share (%) | Growth (%) | ||
| Major Commodity Group | Aug’21 | Aug’20 | Aug’21 | Aug ’21 over Aug ’20 |
| Engineering Goods | 9631.50 | 6065.65 | 29.06 | 58.79 |
| Petroleum Products | 4559.82 | 1901.64 | 13.76 | 139.78 |
| Gems And Jewellery | 3428.07 | 1823.09 | 10.34 | 88.04 |
| Organic And Inorganic Chemicals | 2230.15 | 1642.82 | 6.73 | 35.75 |
| Drugs And Pharmaceuticals | 2001.78 | 1977.76 | 6.04 | 1.21 |
| Cotton Yarn/Fabrics/Madeups, Handloom Products Etc. | 1297.82 | 833.95 | 3.92 | 55.62 |
| RMG Of All Textiles | 1235.11 | 1083.53 | 3.73 | 13.99 |
| Electronic Goods | 1146.63 | 872.04 | 3.46 | 31.49 |
| Plastic And Linoleum | 753.30 | 648.49 | 2.27 | 16.16 |
| Rice | 715.24 | 671.08 | 2.16 | 6.58 |
| Total of 10 Major Commodity Groups | 26999.42 | 17520.05 | 81.47 | 54.11 |
| Rest | 6141.16 | 5309.23 | 18.53 | 15.67 |
| Total Exports | 33140.58 | 22829.29 | 100.00 | 45.17 |
Top 10 major commodity groups, covering more than 80% of total imports, have shown below.
| Statement 8: Imports of Top 10 Major Commodity Groups | ||||
| Import (Million US$) | Share (%) | Growth (%) | ||
| Major Commodity Group | Aug.’21 | Aug.’20 | Aug.’21 | Aug.’21 over Aug.’20 |
| Petroleum, Crude & products | 11637.86 | 6451.91 | 24.76 | 80.38 |
| Gold | 6746.88 | 3702.53 | 14.35 | 82.22 |
| Electronic goods | 5910.44 | 4720.09 | 12.57 | 25.22 |
| Machinery, electrical & non-electrical | 2914.75 | 2020.92 | 6.20 | 44.23 |
| Pearls, precious & Semi-precious stones | 2243.51 | 1163.26 | 4.77 | 92.86 |
| Organic & Inorganic Chemicals | 2066.48 | 1469.05 | 4.40 | 40.67 |
| Coal, Coke & Briquettes, etc. | 1936.40 | 1084.77 | 4.12 | 78.51 |
| Artificial resins, plastic materials, etc. | 1365.19 | 849.61 | 2.90 | 60.69 |
| Iron & Steel | 1333.57 | 640.23 | 2.84 | 108.30 |
| Vegetable Oil | 1322.01 | 888.65 | 2.81 | 48.77 |
| Total of 10 Major Commodity Groups | 37477.09 | 22991.03 | 79.73 | 63.01 |
| Rest | 9529.42 | 8042.98 | 20.27 | 18.48 |
| Total Imports | 47006.51 | 31034.01 | 100.00 | 51.47 |