INDIA’S FOREIGN TRADE: November 2020
*Note: i) The latest data for services sector released by RBI is for October 2020. The data for November 2020 is an estimation, which will be revised based on RBI’s subsequent release ii) the figures in bracket are growth rates vis-à-vis corresponding period of last year.
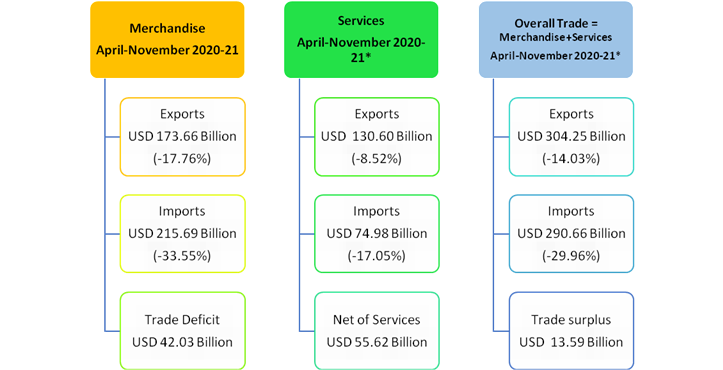
India’s overall exports (Merchandise and Services combined) in April-November2020-21* are estimated to be USD 304.25 Billion, exhibiting a negative growth of (-) 14.03per cent over the same period last year. Overall imports in April-November 2020-21* are estimated to be USD 290.66Billion, exhibiting a negative growth of (-) 29.96per cent over the same period last year.
I. MERCHANDISE TRADE
EXPORTS (including re-exports)
- Exports inNovember2020 were USD23.52Billion, as compared to USD25.77Billion in November 2019, exhibiting a negative growth of (-) 8.74per cent. In Rupee terms, exports were Rs. 1,74,559.49Crore in November2020, as compared to Rs. 1,84,142.27Crore in November2019, registering a negative growth of (-) 5.20per cent.
- The commodities/commodity groups which have recorded positive growth during November 2020 vis-à-vis November 2019 are Other cereals (171.63%), Oil meals (72.09%), Iron ore (68.15%), Rice (25.88%), Ceramic products & glassware (21.38%), Handicrafts excl. handmade carpet (17.99%), Cereal preparations & miscellaneous processed items (17.04%), Carpet (15.59%), Jute mfg. including floor covering (14.3%), Spices (12.37%), Drugs & pharmaceuticals (11.15%), Tobacco (8.64%), Cotton yarn/fabs./made-ups, handloom products etc. (8.54%), Fruits & vegetables (6.08%), Tea (5.02%), Gems & jewellery (4.1%), Mica, Coal & other ores, minerals including processed minerals (3.69%), Meat, dairy & poultry products (1.35%) and Electronic Goods (0.97%).
- The commodities/commodity groups which have recorded negative growth during November 2020 vis-à-vis November 2019 are Petroleum products (-59.73%), Leather & leather products (-29.8%), Cashew (-24.53%), Plastic & Linoleum (-23.26%), Marine products (-16.1%), Oil seeds (-15.2%), Man-made yarn/fabs./made-ups etc. (-11.06%), Engineering goods (-8.12%), Organic & inorganic chemicals (-8.06%), Coffee (-1.27%) and RMG of all textiles (-1.19%).
- Cumulative value of exports for the period April-November 2020-21 was USD173.66Billion (Rs.12,95,935.38Crore) as against USD211.17Billion (Rs.14,84,386.50Crore) during the period April-November 2019-20, registering a negative growth of (-) 17.76per cent in Dollar terms (negative growth of (-) 12.70per cent in Rupee terms).
- Non-petroleum and Non-Gems and Jewellery exports in November 2020 were USD19.29Billion, as compared to USD19.37Billion in November2019, registering a negative growth of (-) 0.40per cent. Non-petroleum and Non-Gems and Jewellery exports in April-November 2020-21 were USD144.11Billion, as compared to USD157.09Billion for the corresponding period in 2019-20, which is a decrease of (-) 8.26 per cent.
IMPORTS
- Imports in November2020 were USD33.39Billion (Rs.2,47,839.85Crore), which is a decline of(-) 13.32per cent in Dollar terms and (-) 9.96per cent in Rupee terms over imports of USD38.52Billion (Rs2,75,255.20Crore) in November2019. Cumulative value of imports for the period April-November 2020-21 was USD215.69Billion (Rs.16,09,382.96Crore), as against USD324.59Billion (Rs.22,80,659.04Crore) during the period April-November 2019-20, registering a negative growth of (-) 33.55per cent in Dollar terms and a negative growth of (-) 29.43per cent in Rupee terms.
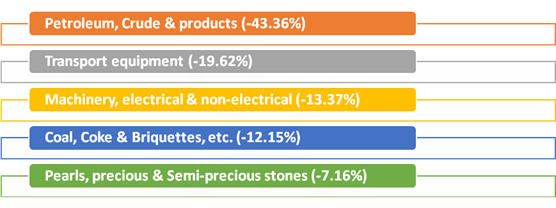
- Major commodity groups of import showing negative growth in November2020 over the corresponding month of last year are:
CRUDE OIL AND NON-OIL IMPORTS:
- Oil imports inNovember2020 were USD6.27Billion (Rs. 46,529.71Crore), which was 43.36per centlower in Dollar terms (41.17per centlower in Rupee terms), compared to USD11.07Billion (Rs. 79,090.66Crore) in November2019. Oil imports inApril-November 2020-21 were USD44.11Billion (Rs. 3,29,460.58Crore) which was 48.71per cent lower in Dollar terms (45.48per cent lower in Rupee terms) compared to USD85.99Billion (Rs. 6,04,310.34Crore), over the same period last year.
- In this connection it is mentioned that the global Brent price ($/bbl) has decreased by 31.10% in November2020 vis-à-vis November2019 as per data available from World Bank.
- Non-oil imports inNovember2020 were estimated at USD27.12Billion (Rs. 2,01,310.14Crore) which was 1.20per cent lower in Dollar terms (2.62 per centhigher in Rupee terms), compared to USD27.45Billion (Rs. 1,96,164.54Crore) in November2019. Non-oil imports inApril-November 2020-21 were USD171.58Billion (Rs. 12,79,922.38Crore) which was 28.09per cent lower in Dollar terms (23.65per cent lower in Rupee terms), compared to USD238.60Billion (Rs. 16,76,348.70Crore) in April-November2019-20.
- Non-Oil and Non-Gold imports wereUSD24.10Billion in November2020, recording a negative growth of (-) 1.67per cent, as compared to Non-Oil and Non-Gold importsof USD 24.51Billion in November2019. Non-Oil and Non-Gold imports wereUSD159.28Billion in April-November 2020-21, recording a negative growth of (-) 26.94per cent, as compared to Non-Oil and Non-Gold imports ofUSD 218.01Billion in April-November 2019-20.
II. TRADE IN SERVICES
EXPORTS (Receipts)
- As per the latest press release by RBI dated 15thDecember 2020, exports in October2020 were USD 16.58Billion (Rs.1,21,815.57Crore) registering a negative growth of (-) 6.30per cent in Dollar terms, vis-à-vis October2019. The estimated value of services export for November2020* is USD 16.45Billion.
IMPORTS (Payments)
- As per the latest press release by RBI dated 15th December 2020, imports in October 2020 were USD 9.53Billion (Rs. 69,968.84Crore) registering a negative growth of (-) 12.33per cent in Dollar terms, vis-à-vis October2019. The estimated value of services import for November2020* is USD 9.37Billion.
III.TRADE BALANCE
- MERCHANDISE: The trade deficit for November2020 was estimated at USD9.87Billion as against the deficit of USD12.75Billion inNovember2019, which is a decline of (-) 22.57per cent.
- SERVICES: As per RBI’s Press Release dated 15th December 2020, the trade balance in Services (i.e. Net Services export) for October 2020 is USD7.06Billion. The estimated trade balance in November 2020* is USD 7.08Billion.
- OVERALL TRADE BALANCE: Taking merchandise and services together, overall trade surplus for April-November 2020-21* is estimated at USD13.59Billion as compared to the deficit of USD61.06Billion in April-November 2019-20.
*Note: The latest data for services sector released by RBI is for October2020. The data for November2020 is an estimation, which will be revised based on RBI’s subsequent release.
MERCHANDISE TRADE
| EXPORTS & IMPORTS : (US $ Billion) | ||
| (PROVISIONAL) | ||
| NOVEMBER | APRIL-NOVEMBER | |
| EXPORTS(including re-exports) | ||
| 2019-20 | 25.77 | 211.17 |
| 2020-21 | 23.52 | 173.66 |
| %Growth 2020-21/ 2019-20 | -8.74 | -17.76 |
| IMPORTS | ||
| 2019-20 | 38.52 | 324.59 |
| 2020-21 | 33.39 | 215.69 |
| %Growth 2020-21/ 2019-20 | -13.32 | -33.55 |
| TRADE BALANCE | ||
| 2019-20 | -12.75 | -113.42 |
| 2020-21 | -9.87 | -42.03 |
| EXPORTS &IMPORTS: (Rs. Crore) | ||
| (PROVISIONAL) | ||
| NOVEMBER | APRIL-NOVEMBER | |
| EXPORTS(including re-exports) | ||
| 2019-20 | 1,84,142.27 | 14,84,386.50 |
| 2020-21 | 1,74,559.49 | 12,95,935.38 |
| %Growth 2020-21/ 2019-20 | -5.20 | -12.70 |
| IMPORTS | ||
| 2019-20 | 2,75,255.20 | 22,80,659.04 |
| 2020-21 | 2,47,839.85 | 16,09,382.96 |
| %Growth 2020-21/ 2019-20 | -9.96 | -29.43 |
| TRADE BALANCE | ||
| 2019-20 | -91,112.93 | -7,96,272.55 |
| 2020-21 | -73,280.36 | -3,13,447.58 |
SERVICES TRADE
| EXPORTS & IMPORTS (SERVICES) : (US $ Billion) | ||
| (PROVISIONAL) | October 2020 | April-October 2020-21 |
| EXPORTS (Receipts) | 16.58 | 114.15 |
| IMPORTS (Payments) | 9.53 | 65.61 |
| TRADE BALANCE | 7.06 | 48.54 |
| EXPORTS & IMPORTS (SERVICES): (Rs. Crore) | ||
| (PROVISIONAL) | October 2020 | April-October 2020-21 |
| EXPORTS (Receipts) | 1,21,815.57 | 8,54,462.08 |
| IMPORTS (Payments) | 69,968.84 | 4,91,029.52 |
| TRADE BALANCE | 51,846.73 | 3,63,432.56 |
| Source: RBI Press Release dated 15th December 2020 | ||