INDIA’S FOREIGN TRADE: MARCH 2021
*Note: i) The latest data for services sector released by RBI is for February 2021. The data for March 2021 is an estimation, which will be revised based on RBI’s subsequent release ii) the figures in bracket are growth rates vis-à-vis corresponding period of last year.
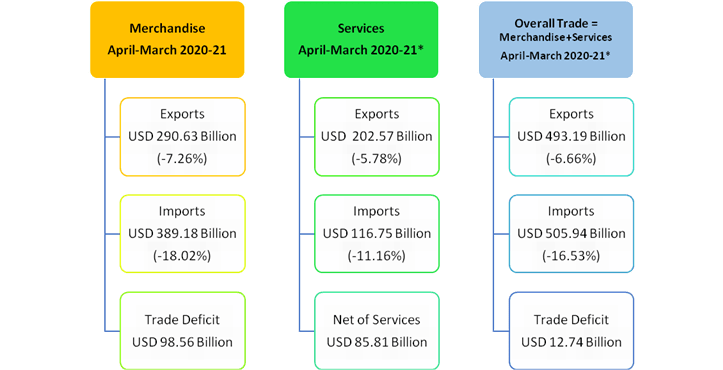
India’s overall exports (Merchandise and Services combined) in April-March2020-21* are estimated to be USD 493.19Billion, exhibiting a negative growth of (-)6.66per cent over the same period last year. Overall imports in April-March 2020-21* are estimated to be USD 505.94Billion, exhibiting a negative growth of (-)16.53per cent over the same period last year.
I. MERCHANDISE TRADE
EXPORTS (including re-exports)
- Exports inMarch2021 were USD34.45Billion, as compared to USD21.49Billion in March 2020, exhibiting a positive growth of 60.29per cent. In Rupee terms, exports were Rs. 2,50,756.40Crore in March2021, as compared to Rs. 1,59,784.62Crore in March2020, registering a positive growth of 56.93per cent.
- The commodities/commodity groups which have recorded positive growth during March 2021 vis-à-vis March 2020 areOther cereals (326.44%), Oil meals (230.4%), Iron ore (194.89%), Jute mfg. including floor covering (105.26%), Electronic goods (91.98%), Carpet (89.84%), Gems & jewellery (78.93%), Engineering goods (71.3%), Cereal preparations & miscellaneous processed items (67.61%), Rice (66.77%), Spices (60.42%), Cotton yarn/fabs./made-ups, handloom products etc. (55.67%), Ceramic products & glassware (53.48%), Meat, dairy & poultry products (52.79%), Drugs & pharmaceuticals (48.49%), Organic & inorganic chemicals (46.5%), Plastic & Linoleum (46.39%), Handicrafts excl. handmade carpet (43.24%), Marine products (40.81%), Petroleum products (35.52%), Man-made yarn/fabs./made-ups etc. (31.37%), Mica, Coal & other ores, minerals including processed minerals (31.28%), RMG of all textiles (27.51%), Fruits & vegetables (23.96%), Coffee (23.27%), Leather & leather products (21.86%), Tobacco (15.57%) and Tea (8%).
- The commodities/commodity groups which have recorded negative growth during March 2021 vis-à-vis March 2020are Oil seeds (-6.45%) and Cashew (-1.99%).
- Cumulative value of exports for the period April-March 2020-21 was USD290.63Billion (Rs.21,50,325.03Crore) as against USD313.36Billion (Rs.22,19,854.18Crore) during the period April-March 2019-20, registering a negative growth of (-)7.26per cent in Dollar terms (negative growth of (-)3.13per cent in Rupee terms).
- Non-petroleum and Non-Gems and Jewellery exports in March 2021 were USD27.42Billion, as compared to USD16.95Billion in March2020, registering a positive growth of 61.75per cent. Non-petroleum and Non-Gems and Jewellery exports in April-March 2020-21 were USD238.72Billion, as compared to USD236.17Billion for the corresponding period in 2019-20, which is anincreaseof 1.08 per cent.
IMPORTS
- Imports in March2021 were USD48.38Billion (Rs.3,52,191.21Crore), which is an increase of53.74per cent in Dollar terms and 50.52per cent in Rupee terms over imports of USD31.47Billion (Rs2,33,988.47Crore) in March2020. Cumulative value of imports for the period April-March 2020-21 was USD389.18Billion (Rs.28,76,918.30Crore), as against USD474.71Billion (Rs.33,60,954.46Crore) during the period April-March 2019-20, registering a negative growth of (-)18.02per cent in Dollar terms and a negative growth of (-)14.40per cent in Rupee terms.
- Major commodity groups of import showing negative growth in March2021 over the corresponding month of last year are:

CRUDE OIL AND NON-OIL IMPORTS:
- Oil imports inMarch2021 were USD10.27Billion (Rs. 74,768.22Crore), which was 2.23percenthigher in Dollar terms (0.08percent higher in Rupee terms), compared to USD10.05Billion (Rs. 74,704.86Crore) in March2020. Oil imports inApril-March 2020-21 were USD82.35Billion (Rs.6,08,881.25Crore) which was 36.92per cent lower in Dollar terms (34.19percent lower in Rupee terms) compared to USD130.55Billion (Rs. 9,25,167.52Crore), over the same period last year.
- In this connection it is mentioned that the global Brent price ($/bbl) has increased by 97.67% in March2021 vis-à-vis March2020 as per data available from World Bank.
- Non-oil imports inMarch2021 were estimated at USD38.11Billion (Rs. 2,77,422.99Crore) which was 77.90percent higher in Dollar terms (74.17percent higher in Rupee terms), compared to USD21.42Billion (Rs. 1,59,283.61Crore) in March2020. Non-oil imports inApril-March 2020-21 were USD306.83Billion (Rs. 22,68,037.05Crore) which was 10.85per cent lower in Dollar terms (6.89percent lower in Rupee terms), compared to USD344.16Billion (Rs. 24,35,786.93Crore) in April-March2019-20.
- Non-Oil and Non-Gold imports wereUSD29.62Billion in March2021, recording a positive growth of 46.66per cent, as compared to Non-Oil and Non-Gold importsof USD 20.20Billion in March2020. Non-Oil and Non-Gold imports wereUSD272.23Billion in April-March 2020-21, recording a negative growth of (-)13.83per cent, as compared to Non-Oil and Non-Gold imports ofUSD 315.93Billion in April-March 2019-20.
II. TRADE IN SERVICES
EXPORTS (Receipts)
- As per the latest press release by RBI dated 15thApril 2021, exports in February 2021 were USD 17.55Billion (Rs.1,27,651.28Crore) registering a negative growth of (-)1.02per cent in Dollar terms, vis-à-vis February2020. The estimated value of services export for March2021* is USD 17.75Billion.
IMPORTS (Payments)
- As per the latest press release by RBI dated 15thApril 2021, imports in February 2021were USD 10.61Billion (Rs. 77,216.47Crore) registering a negative growth of (-)4.10per cent in Dollar terms, vis-à-vis February 2020. The estimated value of services import for March2021* is USD 10.84Billion.
III.TRADE BALANCE
- MERCHANDISE: The trade deficit for March2021 was estimated at USD13.93Billion as against the deficit of USD9.98Billion inMarch2020, which is an increase of 39.62 percent.
- SERVICES: As per RBI’s Press Release dated 15thApril 2021, the trade balance in Services (i.e. Net Services export) for February 2021is USD6.93Billion. The estimated trade balance in March 2021* is USD 6.91Billion.
- OVERALL TRADE BALANCE: Taking merchandise and services together, overall trade deficit for April-March 2020-21* is estimated at USD12.74Billion as compared to the deficit of USD77.76Billion in April-March 2019-20.
*Note: The latest data for services sector released by RBI is for February 2021. The data for March2021 is an estimation, which will be revised based on RBI’s subsequent release.
MERCHANDISE TRADE
SERVICES TRADE