INDIA’S FOREIGN TRADE: JULY2021
India’s overall exports (Merchandise and Services combined) in July 2021* are estimated to be USD 54.95Billion, exhibiting a positive growth of 36.19 per cent over the same period last year and a positive growth of 23.24 per cent over July 2019. Overall imports in July 2021* are estimated to be USD 57.29Billion, exhibiting a positive growth of 50.15per cent over the same period last year and a positive growth of 10.60 per cent over July 2019
| July 2021 (USD Billion) | July 2020 (USD Billion) | July 2019 (USD Billion) | Growth vis-à-vis July 2020 (%) | Growth vis-à-vis July 2019 (%) | ||
| Merchandise | Exports | 35.43 | 23.64 | 26.23 | 49.85 | 35.05 |
| Imports | 46.40 | 28.47 | 40.43 | 62.99 | 14.77 | |
| Trade Balance | -10.97 | -4.83 | -14.20 | -127.37 | 22.71 | |
| Services* | Exports | 19.52 | 16.71 | 18.36 | 16.86 | 6.35 |
| Imports | 10.89 | 9.69 | 11.37 | 12.42 | -4.21 | |
| Net of Services | 8.64 | 7.02 | 6.99 | 22.99 | 23.53 | |
| Overall Trade (Merchandise+ Services)* | Exports | 54.95 | 40.35 | 44.59 | 36.19 | 23.24 |
| Imports | 57.29 | 38.15 | 51.80 | 50.15 | 10.60 | |
| Trade Balance | -2.34 | 2.20 | -7.21 | -206.43 | 67.57 |
* Note: The latest data for services sector released by RBI is for June 2021. The data for July 2021 is an estimation, which will be revised based on RBI’s subsequent release.(ii) Data for2019 and 2020 are revised on pro-rata basis using quarterly balance of payments data.
India’s overall exports (Merchandise and Services combined) in April-July 2021* are estimated to be USD 204.97 Billion, exhibiting a positive growth of 47.87 per cent over the same period last year and a positive growth of 15.35 per cent over April-July 2019. Overall imports in April-July 2021* are estimated to be USD 214.71 Billion, exhibiting a positive growth of 72.06 per cent over the same period last year and a positive growth of 0.32 per cent over April-July 2019.
| April-July 2021 (USD Billion) | April-July 2020 (USD Billion) | April-July 2019 (USD Billion) | Growth vis-à-vis April-July 2020 (%) | Growth vis-à-vis April-July 2019 (%) | ||
| Merchandise | Exports | 130.82 | 74.96 | 107.15 | 74.52 | 22.09 |
| Imports | 172.55 | 88.91 | 170.53 | 94.08 | 1.18 | |
| Trade Balance | -41.73 | -13.95 | -63.39 | -199.22 | 34.17 | |
| Services* | Exports | 74.15 | 63.66 | 70.55 | 16.48 | 5.10 |
| Imports | 42.16 | 35.88 | 43.49 | 17.51 | -3.04 | |
| Net of Services | 31.99 | 27.78 | 27.07 | 15.15 | 18.19 | |
| Overall Trade (Merchandise+ Services)* | Exports | 204.97 | 138.62 | 177.70 | 47.87 | 15.35 |
| Imports | 214.71 | 124.79 | 214.02 | 72.06 | 0.32 | |
| Trade Balance | -9.74 | 13.84 | -36.32 | -170.38 | 73.19 |
* Note: The latest data for services sector released by RBI is for June 2021. The data for July 2021 is an estimation, which will be revised based on RBI’s subsequent release.(ii) Data for 2019 and 2020 are revised on pro-rata basis using quarterly balance of payments data.
I. MERCHANDISE TRADE
EXPORTS (including re-exports)
- Exports in July 2021 were USD 35.43 Billion, as compared to USD 23.64 Billion in July 2020, exhibiting a positive growth of 49.85 per cent. In Rupee terms, exports were Rs. 2,64,033.76 Crore in July 2021, as compared to Rs. 1,77,305.79 Crore in July 2020, registering a positive growth of 48.91 per cent. As compared to July 2019, exports in July 2021 exhibited a positive growth of 35.05 per cent in Dollar terms and 46.27per cent in Rupee terms.
- The commodities/commodity groups which have recorded positive growth during July 2021 vis-à-vis July 2020 arePetroleum products (230.98%), Gems &jewellery (130.5%), Other Cereals(108.86%), Man-made yarn/fabs./made-ups etc. (58.93%), Cotton yarn/fabs./made-ups, Handloom products etc. (48.35%), Marine products (47.68%), Electronic goods (47.58%), Engineering goods (42.59%), Handicrafts excl. hand made Carpet (32.61%), RMGof all textiles (30.59%), Organic &inorganic chemicals (28.47%), Carpet (25.72%), Plastic & Linoleum (24.14%), Jute mfg. including floor covering (22.08%), Mica, Coal &other ores, minerals including processed minerals (18.17%), Cereal preparations &miscellaneous processed items (17.2%), Leather &Leather products (16.46%), Ceramic products &glassware (7.19%), Drugs &pharmaceuticals (4.11%) and Fruits & Vegetables (0.82%).
- The commodities/commodity groups which have recorded negative growth during July 2021 vis-à-vis July 2020 are Oil seeds (-38.59%), Oil meals (-33.85%), Meat, dairy & poultry products (-31.96%), Tobacco (-10.31%), Tea (-8.96%), Spices (-8.34%), Rice (-7.25%), Cashew (-3.6%), Iron ore (-3.39%) and Coffee (-1.89%).
- Cumulative value of exports for the period April-July 2021 was USD 130.82 Billion (Rs. 9,67,579.13Crore) as against USD 74.96 Billion (Rs. 5,66,322.06 Crore) during the period April-July 2020, registering a positive growth of 74.52 per cent in Dollar terms (positive growth of 70.85 per cent in Rupee terms). As compared to April-July 2019, exports in April-July 2021 exhibited a positive growth of 22.09 per cent in Dollar terms and 30.17 per cent in Rupee terms.
- Non-petroleum and Non-Gems and Jewellery exports in July 2021 were USD 26.12 Billion, as compared to USD 20.37 Billion in July 2020, registering a positive growth of 28.18 per cent. As compared to July 2019, Non-petroleum and Non-Gems and Jewellery exports in July 2021registered a positive growth of 32.26 per cent. Non-petroleum and Non-Gems and Jewellery exports in April-July 2021 were USD 99.36 Billion, as compared to USD 64.29 Billion for the corresponding period in 2020-21, which is an increase of 54.55 per cent. As compared to April-July 2019, Non-petroleum and Non-Gems and Jewellery exports in April-July 2021 registered a positive growth of 24.08 per cent.
IMPORTS
- Imports in July 2021 were USD 46.40 Billion (Rs.3,45,814.93 Crore), which is an increase of 62.99 per cent in Dollar terms and 61.97 per cent in Rupee terms over imports of USD 28.47 Billion (Rs 2,13,499.56 Crore) in July 2020. Imports in July 2021 have registered a positive growth of14.77 per cent in Dollar terms and 24.31 per cent in Rupee terms in comparison to July 2019. Cumulative value of imports for the period April-July 2021 was USD 172.55 Billion (Rs. 12,76,776.03 Crore), as against USD 88.91 Billion (Rs. 6,71,894.74 Crore) during the period April-July 2020, registering a positive growth of 94.08 per cent in Dollar terms and a positive growth of 90.03 per cent in Rupee terms. Imports in April-July 2021 have registered a positive growth of 1.18 per cent in Dollar terms and positive growth of 7.92 per cent in Rupee terms in comparison to April-July 2019.
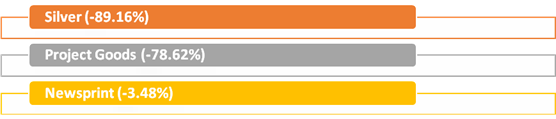
- Major commodity groups of import showing negative growth in July2021 over the corresponding month of last year are:
CRUDE OIL AND NON-OIL IMPORTS:
- Oil imports in July 2021 were USD 12.89Billion (Rs. 96,099.67 Crore), which was 97.45 percent higher in Dollar terms (96.22 percent higher in Rupee terms), compared to USD 6.53 Billion (Rs. 48,975.09 Crore) in July 2020. As compared to July 2019, oil imports in July 2021 were 32.27 percent higher in Dollar terms and 43.26per cent higher in Rupee terms. Oil imports in April-July 2021 were USD 43.90 Billion (Rs.3,24,856.12 Crore) which was 123.84 per cent higher in Dollar terms (119.15 percent higher in Rupee terms) compared to USD 19.61 Billion (Rs. 1,48,234.51 Crore), over the same period last year. As compared to April-July 2019, oil imports in April-July 2021 were 2.69 percent lower in Dollar terms and 3.78per cent higher in Rupee terms.
- In this connection it is mentioned that the global Brent price ($/bbl) has increased by 73.77% in July 2021 vis-à-vis July 2020 as per data available from World Bank.
- Non-oil imports in July 2021 were estimated at USD 33.51 Billion (Rs. 2,49,715.26 Crore) which was 52.73 percent higher in Dollar terms (51.78 percent higher in Rupee terms), compared to USD 21.94 Billion (Rs. 1,64,524.47 Crore) in July 2020. As compared to July 2019, Non-oil imports in July 2021, were 9.21per cent higher in Dollar terms and 18.28 per cent higher in Rupee terms. Non-oil imports in April-July 2021 were USD 128.65 Billion (Rs. 9,51,919.91 Crore) which was 85.65 per cent higher in Dollar terms (81.78 percent higher in Rupee terms), compared to USD 69.30 Billion (Rs. 5,23,660.23 Crore) in April-July 2020. As compared to April-July 2019, Non-oil imports in April-July 2021 were 2.57 per cent higher in Dollar terms and 9.40 per cent higher in Rupee terms.
- Non-Oil and Non-Gold imports were USD 29.30Billion in July 2021, recording a positive growth of 45.40per cent, as compared to Non-Oil and Non-Gold imports of USD 20.15Billion in July 2020. Non-Oil and Non-Gold imports in July 2021 recorded a positive growth of 1.15 per cent over July 2019. Non-Oil and Non-Gold imports were USD 116.56Billion in April-July 2021, recording a positive growth of 74.43per cent, as compared to Non-Oil and Non-Gold imports of USD 66.82Billion in April-July 2020. Non-Oil and Non-Gold imports in April-July 2021 recorded a positive growth of 3.83 per cent over April-July 2019.
II. TRADE IN SERVICES
EXPORTS (Receipts)
- As per the latest press release by RBI dated 2nd August 2021, exports in June 2021 were USD 19.73Billion (Rs.1,45,101.10Crore) registering a positive growth of 24.12per cent in Dollar terms, vis-à-vis June2020. The estimated value of services export for July2021* is USD 19.52Billion, exhibiting a positive growth of 16.86 per cent vis-a-vis July 2020 (USD 16.71 Billion) and a positive growth of 6.35 per cent vis-à-vis July 2019 (USD 18.36 Billion).
IMPORTS (Payments)
- As per the latest press release by RBI dated 2nd August 2021, imports in June 2021were USD 11.15Billion (Rs. 81,995.44Crore) registering a positive growth of 24.75per cent in Dollar terms, vis-à-vis June 2020. The estimated value of services import for July2021* is USD 10.89Billion exhibiting a positive growth of 12.42 per cent vis-à-vis July 2020 (USD 9.69 Billion) and a negativegrowth of(-) 4.21 per cent vis-à-vis July 2019 (USD 11.37 Billion).
III.TRADE BALANCE
- MERCHANDISE: The trade balance for July2021 was estimated at USD(-) 10.97Billion as against USD(-) 4.83Billion inJuly2020, which is a declineof (-) 127.37 percent. As compared to July 2019 (USD (-) 14.20 Billion), trade balance in July 2021 exhibited a positive growth of22.71 per cent.
- SERVICES: As per RBI’s Press Release dated 2nd August 2021, the trade balance in Services (i.e. Net Services export) for June 2021is USD8.58Billion. The estimated trade balance in July 2021* is USD 8.64Billion, which is an increase of 22.99 per cent over July 2020 (USD 7.02 Billion) and an increase of23.53 per cent over July2019 (USD 6.99 Billion).
- OVERALL TRADE BALANCE: Taking merchandise and services together, overall trade balance for July 2021* is estimated atUSD (-) 2.34Billion as compared to USD2.20Billion in July 2020, a decline of (-) 206.43 per cent. In comparison to July 2019(USD (-) 7.21 Billion), trade balance in July 2021 exhibited a positive growth of67.57per cent.
*Note: The latest data for services sector released by RBI is for June 2021. The data for July 2021 is an estimation, which will be revised based on RBI’s subsequent release.(ii) Data for 2019 and 2020 are revised on pro-rata basis using quarterly balance of payments data.
MERCHANDISE TRADE
| EXPORTS & IMPORTS: (Rs. Crore) | ||
| (PROVISIONAL) | ||
| JULY | APRIL-JULY | |
| EXPORTS(including re-exports) | ||
| 2019-20 | 1,80,509.26 | 7,43,322.62 |
| 2020-21 | 1,77,305.79 | 5,66,322.06 |
| 2021-22 | 2,64,033.76 | 9,67,579.13 |
| %Growth 2021-22/ 2020-21 | 48.91 | 70.85 |
| %Growth 2021-22/ 2019-20 | 46.27 | 30.17 |
| IMPORTS | ||
| 2019-20 | 2,78,196.42 | 11,83,129.49 |
| 2020-21 | 2,13,499.56 | 6,71,894.74 |
| 2021-22 | 3,45,814.93 | 12,76,776.03 |
| %Growth 2021-22/ 2020-21 | 61.97 | 90.03 |
| %Growth 2021-22/ 2019-20 | 24.31 | 7.92 |
| TRADE BALANCE | ||
| 2019-20 | -97,687.16 | -4,39,806.87 |
| 2020-21 | -36,193.77 | -1,05,572.68 |
| 2021-22 | -81,781.17 | -3,09,196.90 |
SERVICES TRADE